Fig. 5
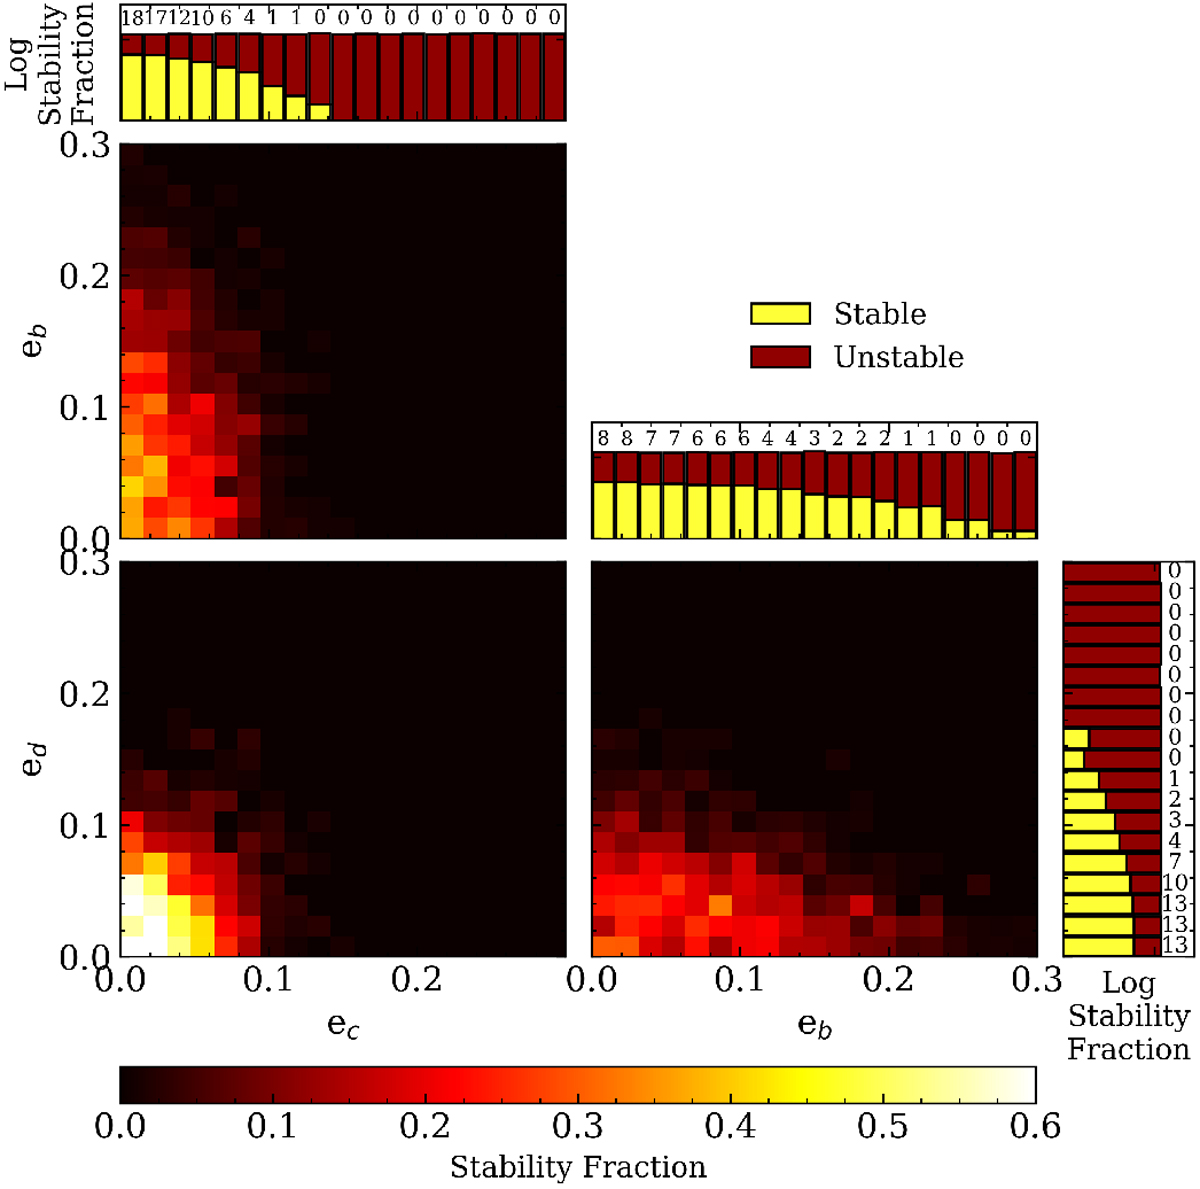
L 98-59 stability maps. The stability fraction of the L 98-59 three planet system as functions of the planet’s initial orbital eccentricities. The 2D maps depict the fraction of stable systems computed from a set of N-body integrations using the planetary masses measured in this study. The 1D histograms depict the number of stable and unstable systems as a function of each planet’s eccentricity separately and marginalized over all other dynamical parameters. The histograms are depicted on a logarithmic scale. The annotated numbers indicate each histogram bin’s stability fraction in percentages.
Current usage metrics show cumulative count of Article Views (full-text article views including HTML views, PDF and ePub downloads, according to the available data) and Abstracts Views on Vision4Press platform.
Data correspond to usage on the plateform after 2015. The current usage metrics is available 48-96 hours after online publication and is updated daily on week days.
Initial download of the metrics may take a while.