Fig. 1.
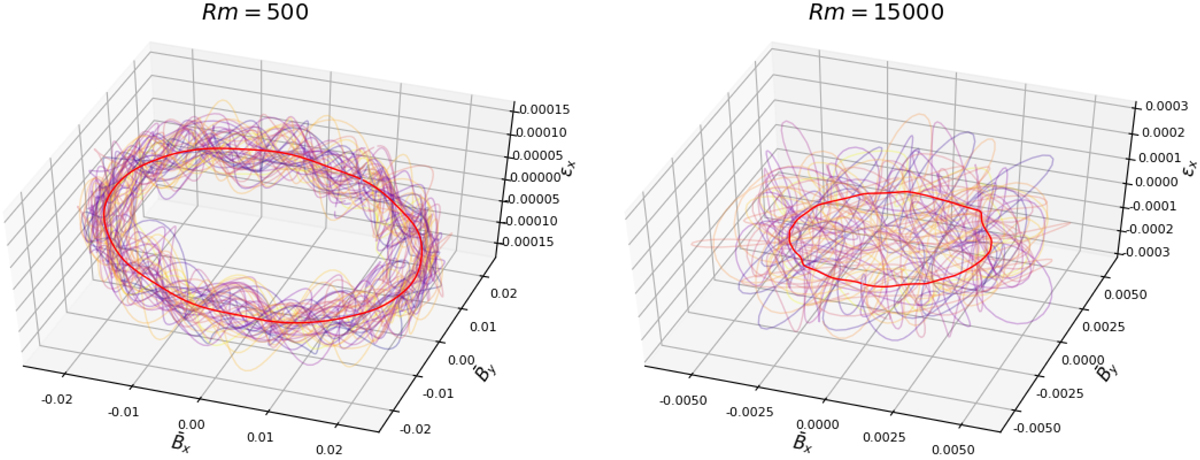
3D parametric visualization of the ![]() vs.
vs. ![]() and ℰx(t, z) fields for different time slices as a function of z (purple curves). The thick red curves show the time averaged (beyond the kinematic regime) vertical profiles for Rm = 500 (left panel), and 1.5 × 10⁴ (right panel). The small Rm simulations have a smoothly evolving circular dependencies while higher Rm cases develop secondary oscillations around the main “torus”. This is consistent with the simulation becoming more “turbulent” as Reynolds number is increased.
and ℰx(t, z) fields for different time slices as a function of z (purple curves). The thick red curves show the time averaged (beyond the kinematic regime) vertical profiles for Rm = 500 (left panel), and 1.5 × 10⁴ (right panel). The small Rm simulations have a smoothly evolving circular dependencies while higher Rm cases develop secondary oscillations around the main “torus”. This is consistent with the simulation becoming more “turbulent” as Reynolds number is increased.
Current usage metrics show cumulative count of Article Views (full-text article views including HTML views, PDF and ePub downloads, according to the available data) and Abstracts Views on Vision4Press platform.
Data correspond to usage on the plateform after 2015. The current usage metrics is available 48-96 hours after online publication and is updated daily on week days.
Initial download of the metrics may take a while.