Fig. 6.
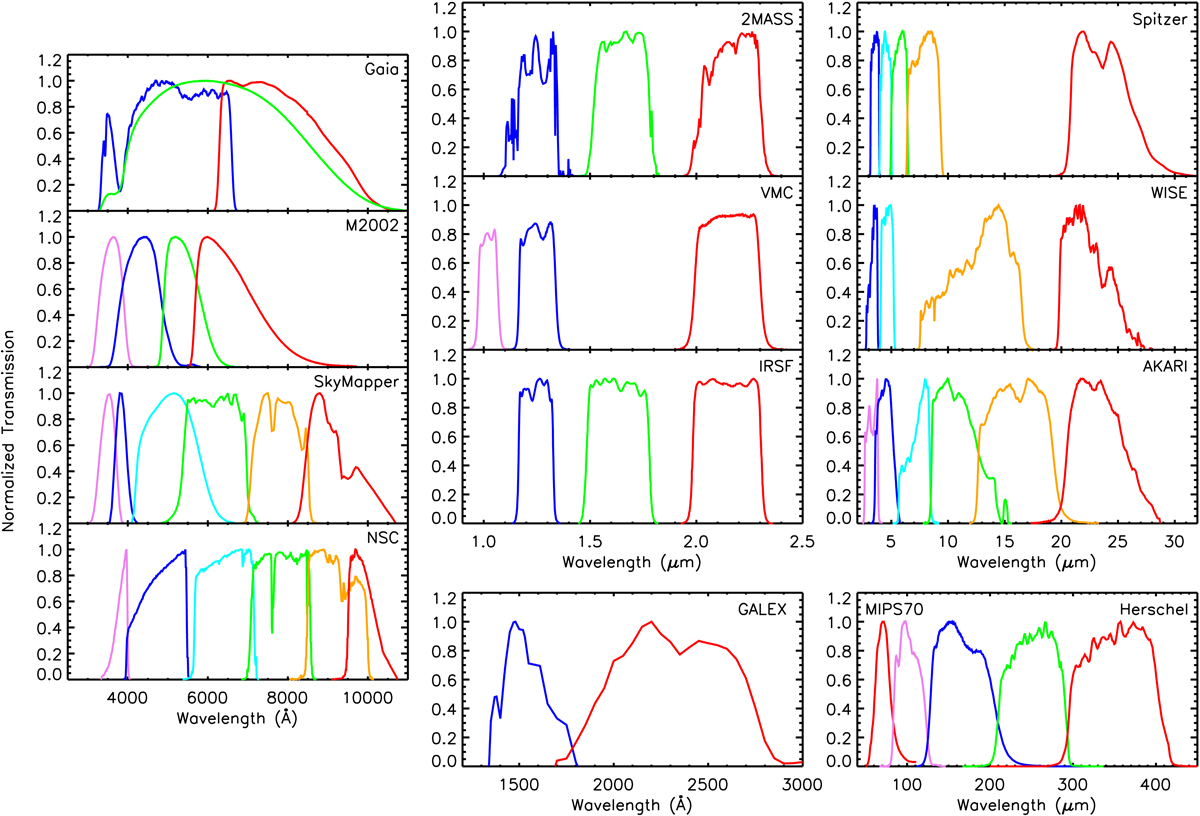
Normalized transmission curves of filters (convolved with the instrument/telescope sensitivities) used in our study. In total, we have 50 filters including 21 optical (includes the two UV filters) and 29 IR filters. For each dataset, the filters are color coded from shorter (blueish) to longer (reddish) wavelengths. Left panel from top to bottom: BP, RP, and G from Gaia, U, B, V, and R from M2002, u, v, g, r, i, and z from SkyMapper, and u, g, r, i, z, and Y from NSC. Middle panel from top to bottom: J, H, KS from 2MASS, Y, J, KS from VMC, J, H, KS from IRSF, and FUV and NUV from GALEX. Right panel from top to bottom: IRAC1, IRAC2, IRAC3, IRAC4, and MIPS24 from Spitzer, WISE1, WISE2, WISE3, and WISE4 from WISE, N3, N4, S7, S11, L15, and L24 from AKARI, and MIPS70 (from Spitzer), PACS100, PACS160, SPIRE250, and SPIRE350 from Herschel.
Current usage metrics show cumulative count of Article Views (full-text article views including HTML views, PDF and ePub downloads, according to the available data) and Abstracts Views on Vision4Press platform.
Data correspond to usage on the plateform after 2015. The current usage metrics is available 48-96 hours after online publication and is updated daily on week days.
Initial download of the metrics may take a while.