Fig. 16.
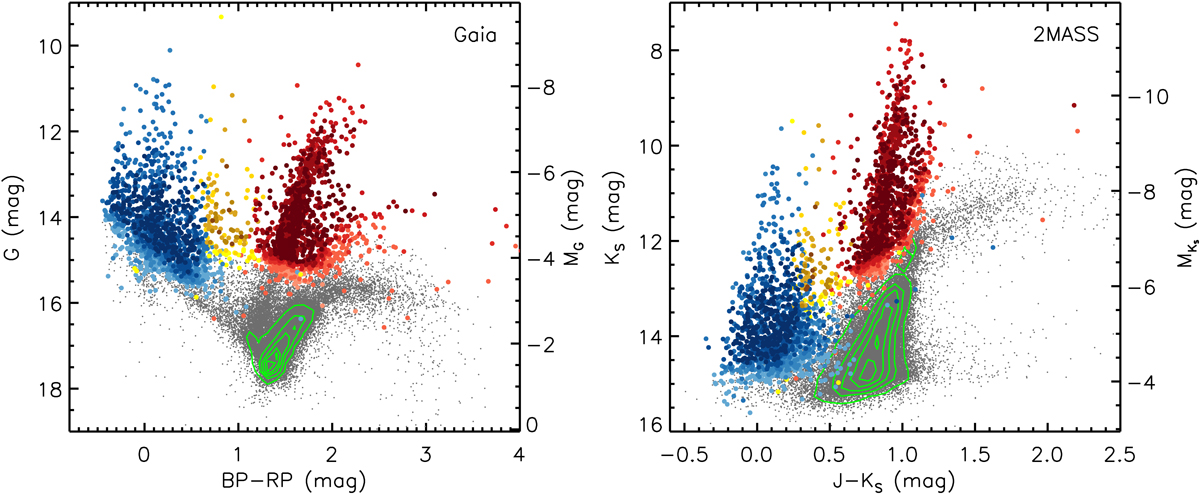
Color-magnitude diagrams of Gaia (left) and 2MASS (right) with RSG (red), YSG (yellow), and BSG (blue) candidates overlapping, where the colors are coded from dark (Rank 0) to light (Rank 5) based on the ranks. The RSG branch extends towards fainter magnitudes with a few candidates scattered in the much fainter and redder region in the optical band, which is likely caused by the circumstellar dust envelope. Green contours represent the number density.
Current usage metrics show cumulative count of Article Views (full-text article views including HTML views, PDF and ePub downloads, according to the available data) and Abstracts Views on Vision4Press platform.
Data correspond to usage on the plateform after 2015. The current usage metrics is available 48-96 hours after online publication and is updated daily on week days.
Initial download of the metrics may take a while.