Fig. 15.
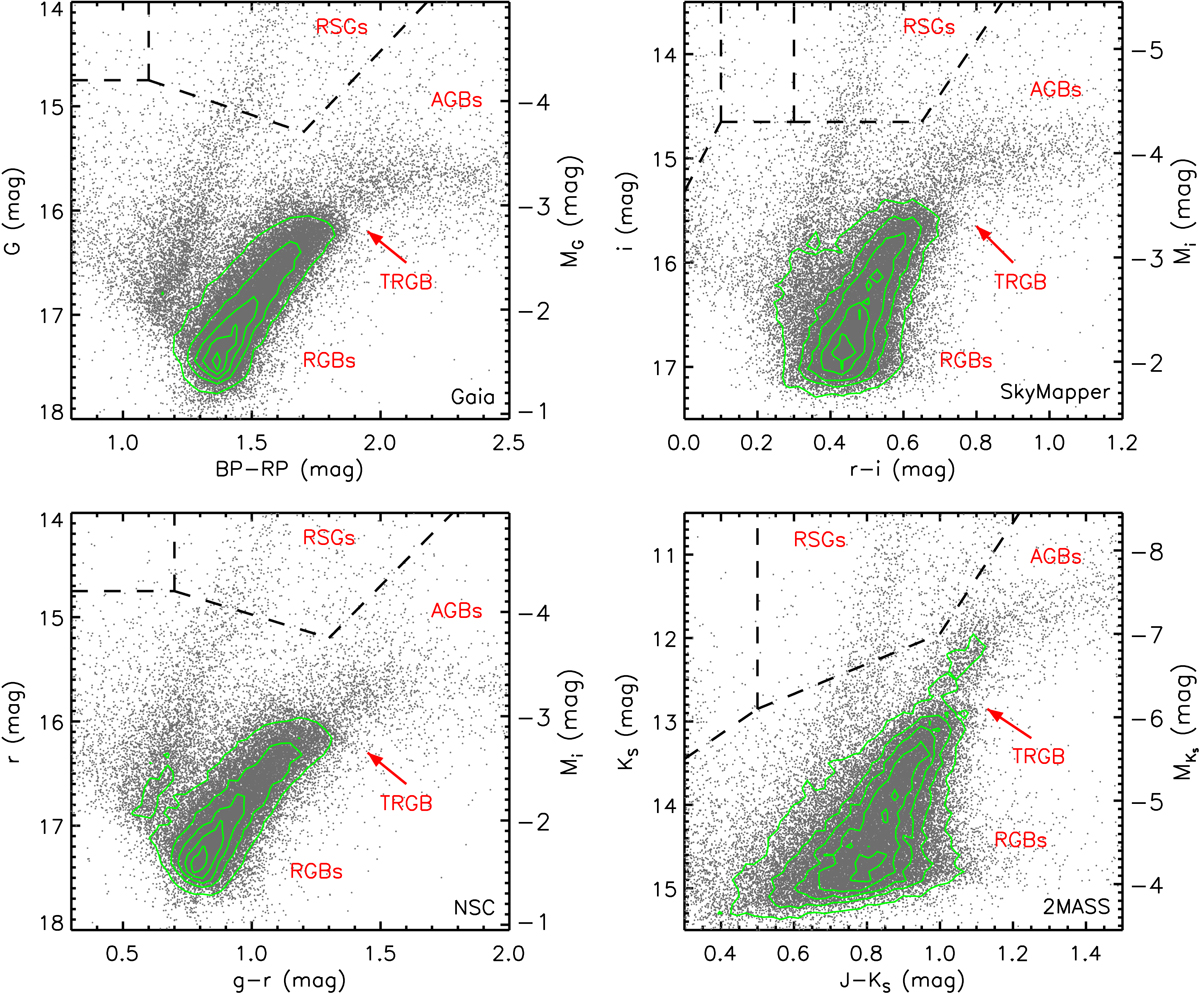
Zoomed-in regions of 0.8 < BP − RP < 2.5 and 14.0 < G < 18.0 for Gaia (upper left), 0 < r − i < 1.2 and 13.5 < i < 17.5 for SkyMapper (upper right), 0.3 < g − r < 2.0 and 14.0 < r < 18.0 for NSC (bottom left), and 0.3 < J − KS < 1.5 and 10.5 < KS < 15.5 for 2MASS (bottom right). The populations of RSGs, AGBs, RGBs, and the TRGB are indicated on the diagram. It can be seen that the separation between the RSG and AGB populations is relatively clear, even at faint magnitude.
Current usage metrics show cumulative count of Article Views (full-text article views including HTML views, PDF and ePub downloads, according to the available data) and Abstracts Views on Vision4Press platform.
Data correspond to usage on the plateform after 2015. The current usage metrics is available 48-96 hours after online publication and is updated daily on week days.
Initial download of the metrics may take a while.