Fig. 14.
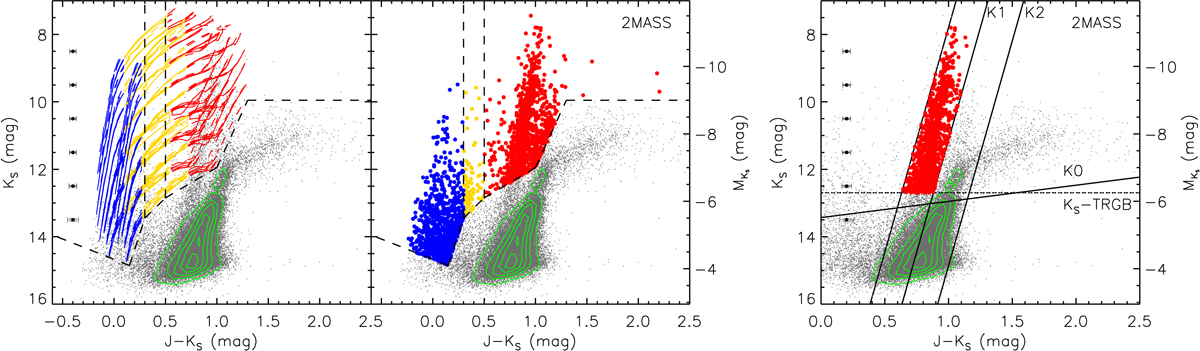
Diagram showing KS vs. J − KS for the 2MASS dataset. Left panel: similar to Fig. 13 as massive star candidates selected by MIST tracks. Right panel: definitions of C-AGB, O-AGB, x-AGB, and RSG regions based on theoretical J − KS color cuts from Cioni et al. (2006a) and Boyer et al. (2011). Targets selected as RSG candidates are shown in red. Green contours represent the number density.
Current usage metrics show cumulative count of Article Views (full-text article views including HTML views, PDF and ePub downloads, according to the available data) and Abstracts Views on Vision4Press platform.
Data correspond to usage on the plateform after 2015. The current usage metrics is available 48-96 hours after online publication and is updated daily on week days.
Initial download of the metrics may take a while.