Fig. 13.
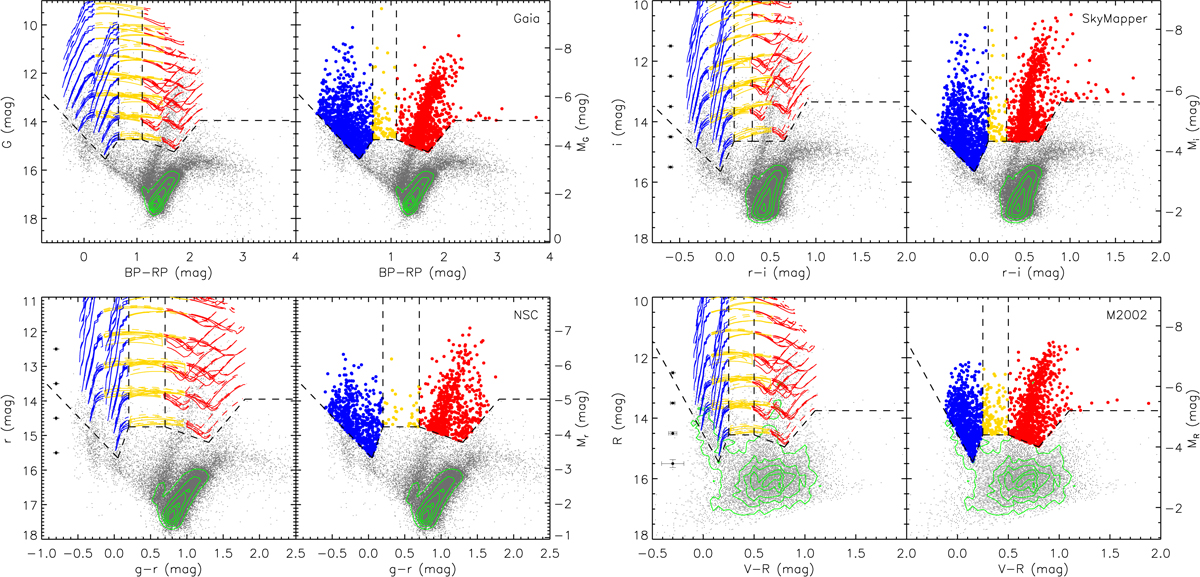
Color-magnitude diagrams of Gaia (upper left), SkyMapper (upper right), NSC (bottom left), and M2002 (bottom right) datasets. In each diagram, left panel: CMD overlapped with MIST evolutionary tracks of 7, 9, 12, 15, 20, 25, 32 and 40 M⊙ and color-coded as BSG (blue), YSG (yellow), and RSG (red) phases. The regions of each type of evolved massive star are outlined by the dashed lines. Targets without errors are not shown in the CMDs, while the average photometric uncertainties are indicated when available. Right panel: selected targets for each type of massive stars with the same color convention. The RSG region is empirically extended as shown by the horizontal dashed lines. Green contours represent the number density. See text for details.
Current usage metrics show cumulative count of Article Views (full-text article views including HTML views, PDF and ePub downloads, according to the available data) and Abstracts Views on Vision4Press platform.
Data correspond to usage on the plateform after 2015. The current usage metrics is available 48-96 hours after online publication and is updated daily on week days.
Initial download of the metrics may take a while.