Fig. 10.
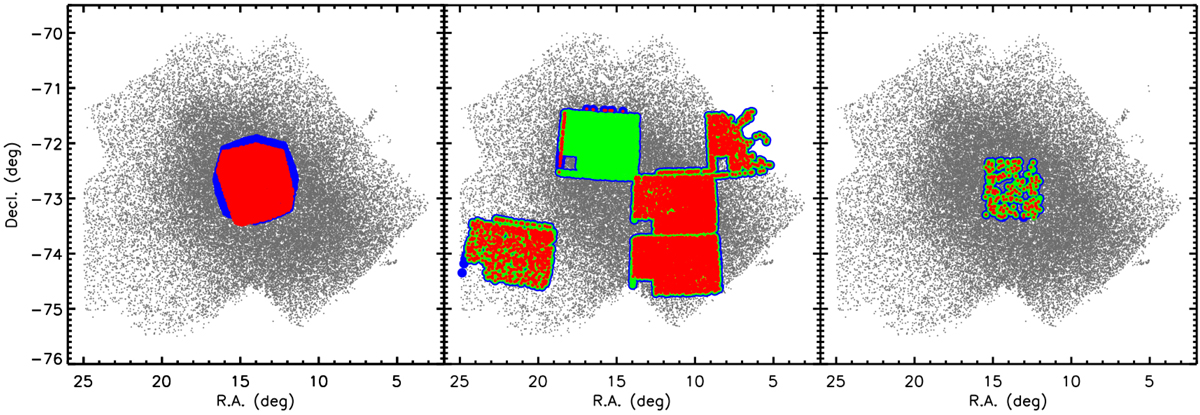
Spatial distribution of targets with IR variability statistics matched with our source catalog within 1″. Left: targets from SAGE-Var project, where blue and red colors indicate the targets in IRAC1 and IRAC2 bands, respectively. Middle: targets from VMC DR4, where blue, green, and red colors indicate the targets in Y, J, and KS bands, respectively. Right: targets from IRSF survey, where blue, green, and red colors indicate the targets in J, H, and KS bands, respectively.
Current usage metrics show cumulative count of Article Views (full-text article views including HTML views, PDF and ePub downloads, according to the available data) and Abstracts Views on Vision4Press platform.
Data correspond to usage on the plateform after 2015. The current usage metrics is available 48-96 hours after online publication and is updated daily on week days.
Initial download of the metrics may take a while.