Fig. C.3.
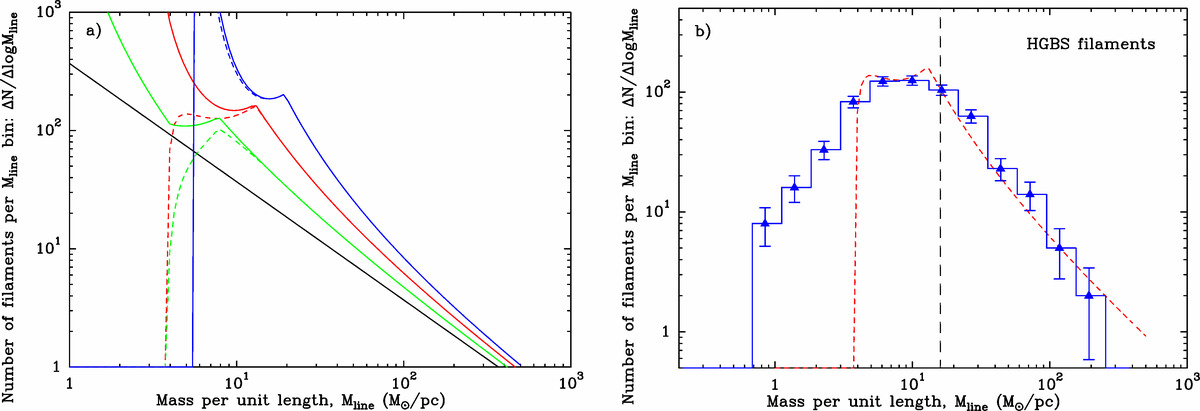
Panel a: evolution of the FLMF according to the improved version of our model where filaments accrete in the same way as in Fig. C.2, but subcritical filaments with Mline < 4 M⊙ pc−1 decay on a timescale ![]() at the same time. The black solid line shows the initial power-law FLMF (dN/dlog
at the same time. The black solid line shows the initial power-law FLMF (dN/dlog ![]() ) determined by interstellar turbulence. The green, red, and blue solid curves show the model FLMF at three time steps,
) determined by interstellar turbulence. The green, red, and blue solid curves show the model FLMF at three time steps, ![]() ,
, ![]() ,
, ![]() after the accretion process is “switched on” at
after the accretion process is “switched on” at ![]() , where
, where ![]() roughly corresponds to ∼0.5–1 Myr. The vertical red and blue lines are the same as in Fig. C.2. The green, red, and blue dashed curves show the same model FLMF taking estimated incompleteness effects into account in the subcritical line mass regime. Panel b: comparison of the model FLMF including incompleteness effects at
roughly corresponds to ∼0.5–1 Myr. The vertical red and blue lines are the same as in Fig. C.2. The green, red, and blue dashed curves show the same model FLMF taking estimated incompleteness effects into account in the subcritical line mass regime. Panel b: comparison of the model FLMF including incompleteness effects at ![]() (dashed red curve) with the observed FLMF from Fig. 1a (blue histogram).
(dashed red curve) with the observed FLMF from Fig. 1a (blue histogram).
Current usage metrics show cumulative count of Article Views (full-text article views including HTML views, PDF and ePub downloads, according to the available data) and Abstracts Views on Vision4Press platform.
Data correspond to usage on the plateform after 2015. The current usage metrics is available 48-96 hours after online publication and is updated daily on week days.
Initial download of the metrics may take a while.