Fig. C.2.
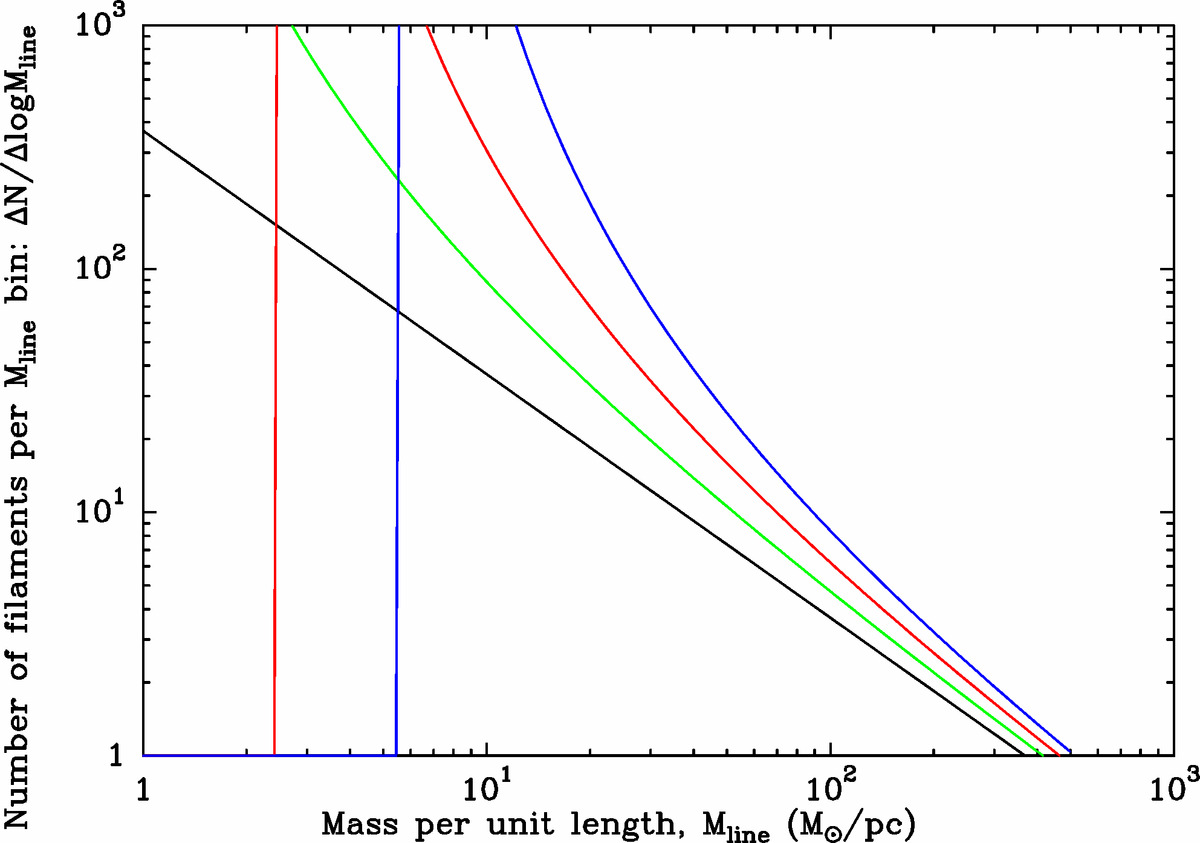
Evolution of the FLMF in the context of the proposed toy accretion model. The black solid line shows the initial power-law FLMF (dN/dlog ![]() ) determined by interstellar turbulence. The green, red, and blue solid curves show the model FLMF at three time steps,
) determined by interstellar turbulence. The green, red, and blue solid curves show the model FLMF at three time steps, ![]() ,
, ![]() ,
, ![]() after the accretion process is “switched on” at
after the accretion process is “switched on” at ![]() , where
, where ![]() roughly corresponds to the time it takes for a critical filament to double its mass per unit length (∼ 0.5–1 Myr). The median logarithmic slope of the model FLMF for 16 < Mline < 500 M⊙ pc−1 is −1, −1.14, −1.30, and −1.50 at
roughly corresponds to the time it takes for a critical filament to double its mass per unit length (∼ 0.5–1 Myr). The median logarithmic slope of the model FLMF for 16 < Mline < 500 M⊙ pc−1 is −1, −1.14, −1.30, and −1.50 at ![]() ,
, ![]() ,
, ![]() , and
, and ![]() , respectively. The vertical red and blue lines correspond to the line mass
, respectively. The vertical red and blue lines correspond to the line mass ![]() accreted by filaments with Mline(0)≈0 at
accreted by filaments with Mline(0)≈0 at ![]() and
and ![]() , respectively.
, respectively.
Current usage metrics show cumulative count of Article Views (full-text article views including HTML views, PDF and ePub downloads, according to the available data) and Abstracts Views on Vision4Press platform.
Data correspond to usage on the plateform after 2015. The current usage metrics is available 48-96 hours after online publication and is updated daily on week days.
Initial download of the metrics may take a while.