Fig. C.1.
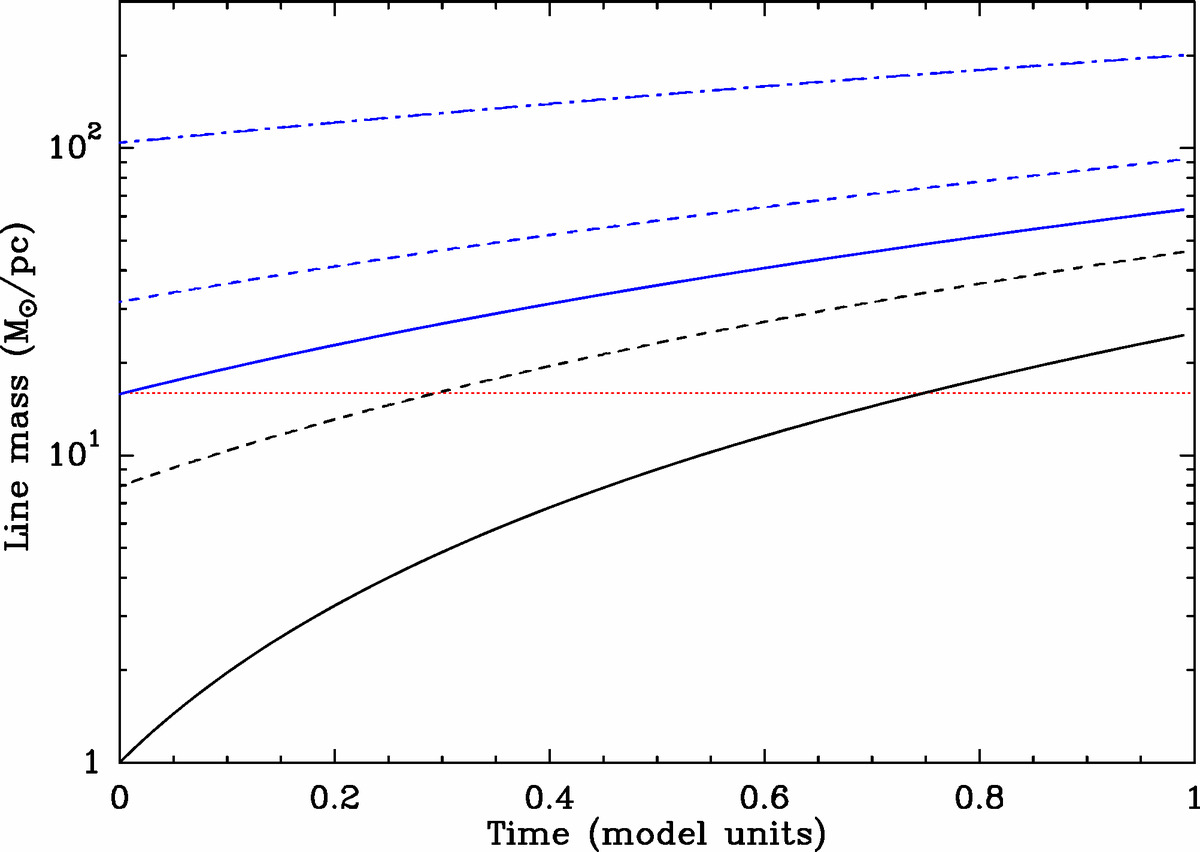
Evolution of the mass per unit length of filaments according to the toy gravitational-accretion model described in the text, for five values of the initial line mass at t = 0: Mline(0) = 1 M⊙ pc−1 (black solid curve), Mline(0)∼8 M⊙ pc−1 (half critical, black dashed curve), Mline(0)∼16 M⊙ pc−1 (critical, blue solid curve), Mline(0)∼32 M⊙ pc−1 (twice critical, blue dashed curve), Mline(0)∼100 M⊙ pc−1 (highly supercritical, blue dash-dotted curve). The red dotted horizontal line marks the critical line mass of ∼16 M⊙ pc−1. Time is normalized in such a way that a critical filament with Mline = Mline, crit at ![]() has Mline = 4 × Mline, crit at
has Mline = 4 × Mline, crit at ![]() (solid blue curve), corresponding to ∼1−2 Myr.
(solid blue curve), corresponding to ∼1−2 Myr.
Current usage metrics show cumulative count of Article Views (full-text article views including HTML views, PDF and ePub downloads, according to the available data) and Abstracts Views on Vision4Press platform.
Data correspond to usage on the plateform after 2015. The current usage metrics is available 48-96 hours after online publication and is updated daily on week days.
Initial download of the metrics may take a while.