Fig. B.2.
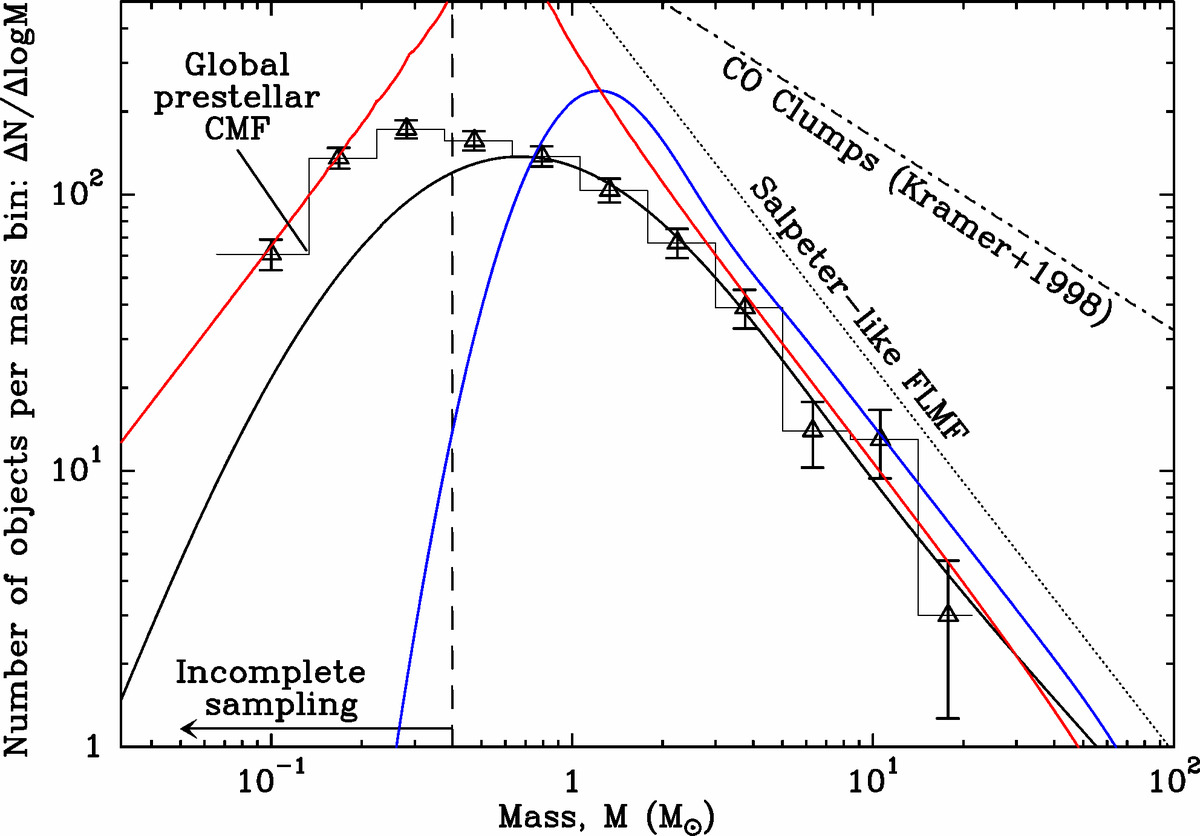
Comparison of the prestellar CMF observed in Orion B (black triangular data points and histogram from Könyves et al. 2019; see also Fig. 3) with the global prestellar CMFs expected in the toy model of Sect. 3, under three assumptions about the shape of the CMF generated by a single filament of line mass Mline: (i) lognormal fMline(m) distribution (Eq. (2)) with ![]() (fiducial case, black curve); (ii) lognormal fMline(m) distribution (Eq. (2)) with fixed σMline = 0.2 independent of Mline (blue curve); and (iii) broken power law, fMline(m)∝m6 for m < MBE, th, fMline(m) = constant for MBE, th ≤ m < MBE, eff, fMline(m)∝m−4 for m > MBE, eff (red curve). For reference, the black dotted line displays the Salpeter-like power-law FLMF, dN/dlog
(fiducial case, black curve); (ii) lognormal fMline(m) distribution (Eq. (2)) with fixed σMline = 0.2 independent of Mline (blue curve); and (iii) broken power law, fMline(m)∝m6 for m < MBE, th, fMline(m) = constant for MBE, th ≤ m < MBE, eff, fMline(m)∝m−4 for m > MBE, eff (red curve). For reference, the black dotted line displays the Salpeter-like power-law FLMF, dN/dlog ![]() , observed in the supercritical line mass regime (see Fig. 1), and the black dash-dotted line shows the typical mass distribution of CO clumps (Kramer et al. 1998).
, observed in the supercritical line mass regime (see Fig. 1), and the black dash-dotted line shows the typical mass distribution of CO clumps (Kramer et al. 1998).
Current usage metrics show cumulative count of Article Views (full-text article views including HTML views, PDF and ePub downloads, according to the available data) and Abstracts Views on Vision4Press platform.
Data correspond to usage on the plateform after 2015. The current usage metrics is available 48-96 hours after online publication and is updated daily on week days.
Initial download of the metrics may take a while.