Fig. B.1.
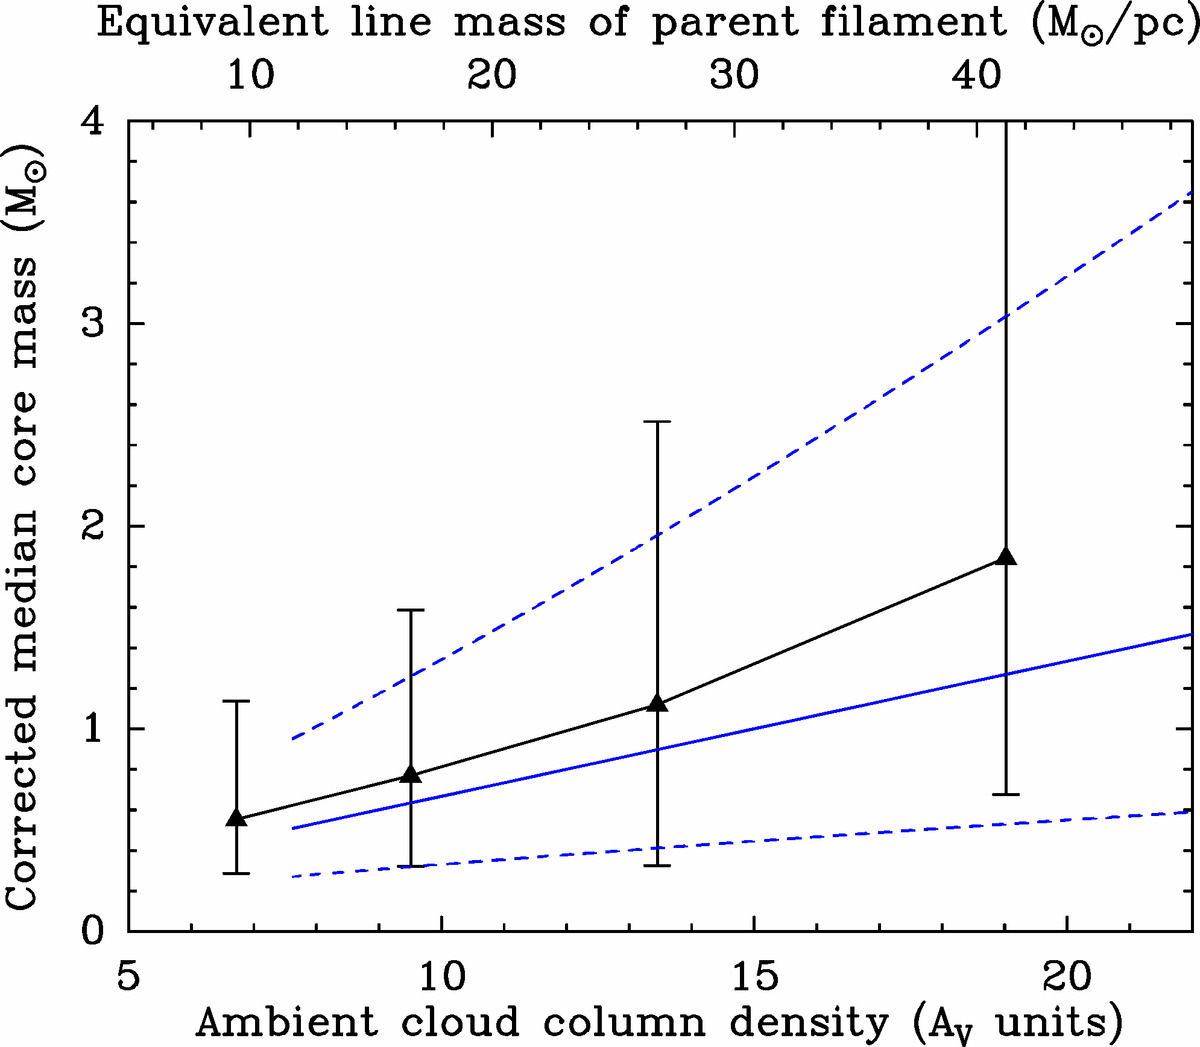
Median prestellar core mass vs. background column density as observed in the Orion B region after correction for incompleteness effects (black triangles, from Könyves et al. 2019), compared to the prediction of the toy model described in Sect. 3 (blue solid line). The error bars correspond to the inter-quartile range in observed masses for each bin of background column density. The two dashed blue lines mark the inter-quartile range expected in the context of the toy model (see Eq. (2)).
Current usage metrics show cumulative count of Article Views (full-text article views including HTML views, PDF and ePub downloads, according to the available data) and Abstracts Views on Vision4Press platform.
Data correspond to usage on the plateform after 2015. The current usage metrics is available 48-96 hours after online publication and is updated daily on week days.
Initial download of the metrics may take a while.