Fig. A.1.
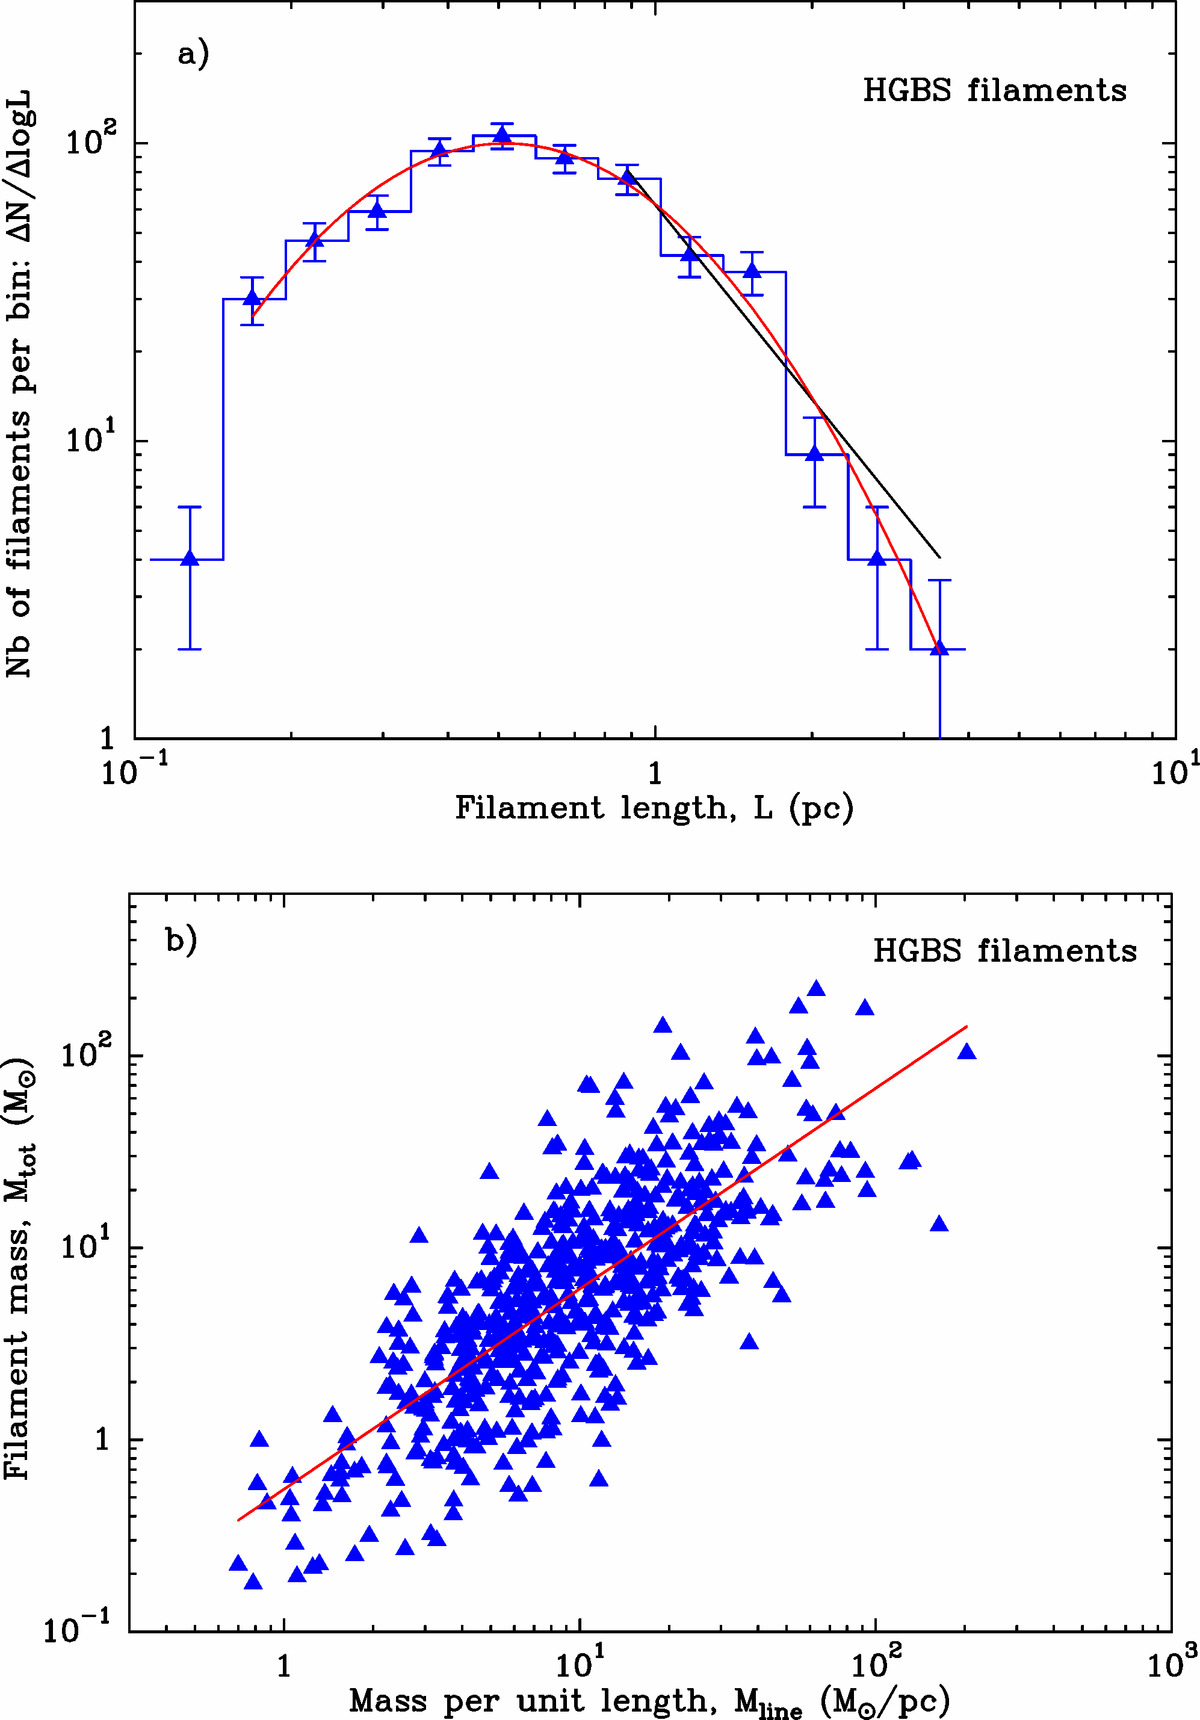
Panel a: differential distribution of lengths for the sample of 599 robust HGBS filaments identified by Arzoumanian et al. (2019). The red curve shows a lognormal fit to the overall distribution, the black solid line segment a power-law fit for filaments longer than 0.9 pc. Panel b: total mass Mtot against average mass per unit length Mline for the same sample of filaments as in the top panel. A strong linear correlation is observed between log Mtot and log Mline (with a Pearson correlation coefficient of ∼77%). The red line shows the best-fit linear relation, Mtot = Mline × Leff, consistent with a typical effective length Leff ∼ 0.55 pc in the filament sample of Arzoumanian et al. (2019).
Current usage metrics show cumulative count of Article Views (full-text article views including HTML views, PDF and ePub downloads, according to the available data) and Abstracts Views on Vision4Press platform.
Data correspond to usage on the plateform after 2015. The current usage metrics is available 48-96 hours after online publication and is updated daily on week days.
Initial download of the metrics may take a while.