Fig. 1.
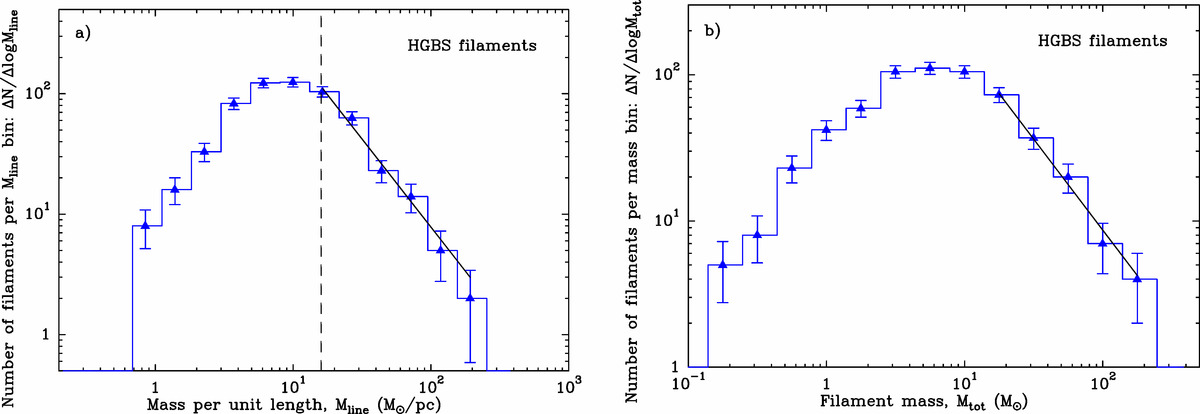
Panel a: differential distribution of crest-averaged masses per unit length for the sample of 599 robust filaments identified by Arzoumanian et al. (2019) in the Herschel GBS maps of eight nearby molecular clouds (IC5146, Orion B, Aquila, Musca, Polaris, Pipe, Taurus L1495, and Ophiuchus). Above the critical mass per unit length Mline, crit ∼ 16 M⊙ pc−1 (vertical dashed line), the filament sample is estimated to be more than 90% complete (see text) and the distribution is well fitted by a Salpeter-like power law ΔN/Δlog ![]() (solid line segment). Panel b: differential distribution of total masses for the same sample of filaments as in the left panel. At the high-mass end (Mtot > 15 M⊙), the distribution of filament masses is well fitted by a Salpeter-like power law ΔN/Δlog
(solid line segment). Panel b: differential distribution of total masses for the same sample of filaments as in the left panel. At the high-mass end (Mtot > 15 M⊙), the distribution of filament masses is well fitted by a Salpeter-like power law ΔN/Δlog ![]() (solid line segment). In both panels, the error bars correspond to
(solid line segment). In both panels, the error bars correspond to ![]() counting uncertainties.
counting uncertainties.
Current usage metrics show cumulative count of Article Views (full-text article views including HTML views, PDF and ePub downloads, according to the available data) and Abstracts Views on Vision4Press platform.
Data correspond to usage on the plateform after 2015. The current usage metrics is available 48-96 hours after online publication and is updated daily on week days.
Initial download of the metrics may take a while.