Fig. 6.
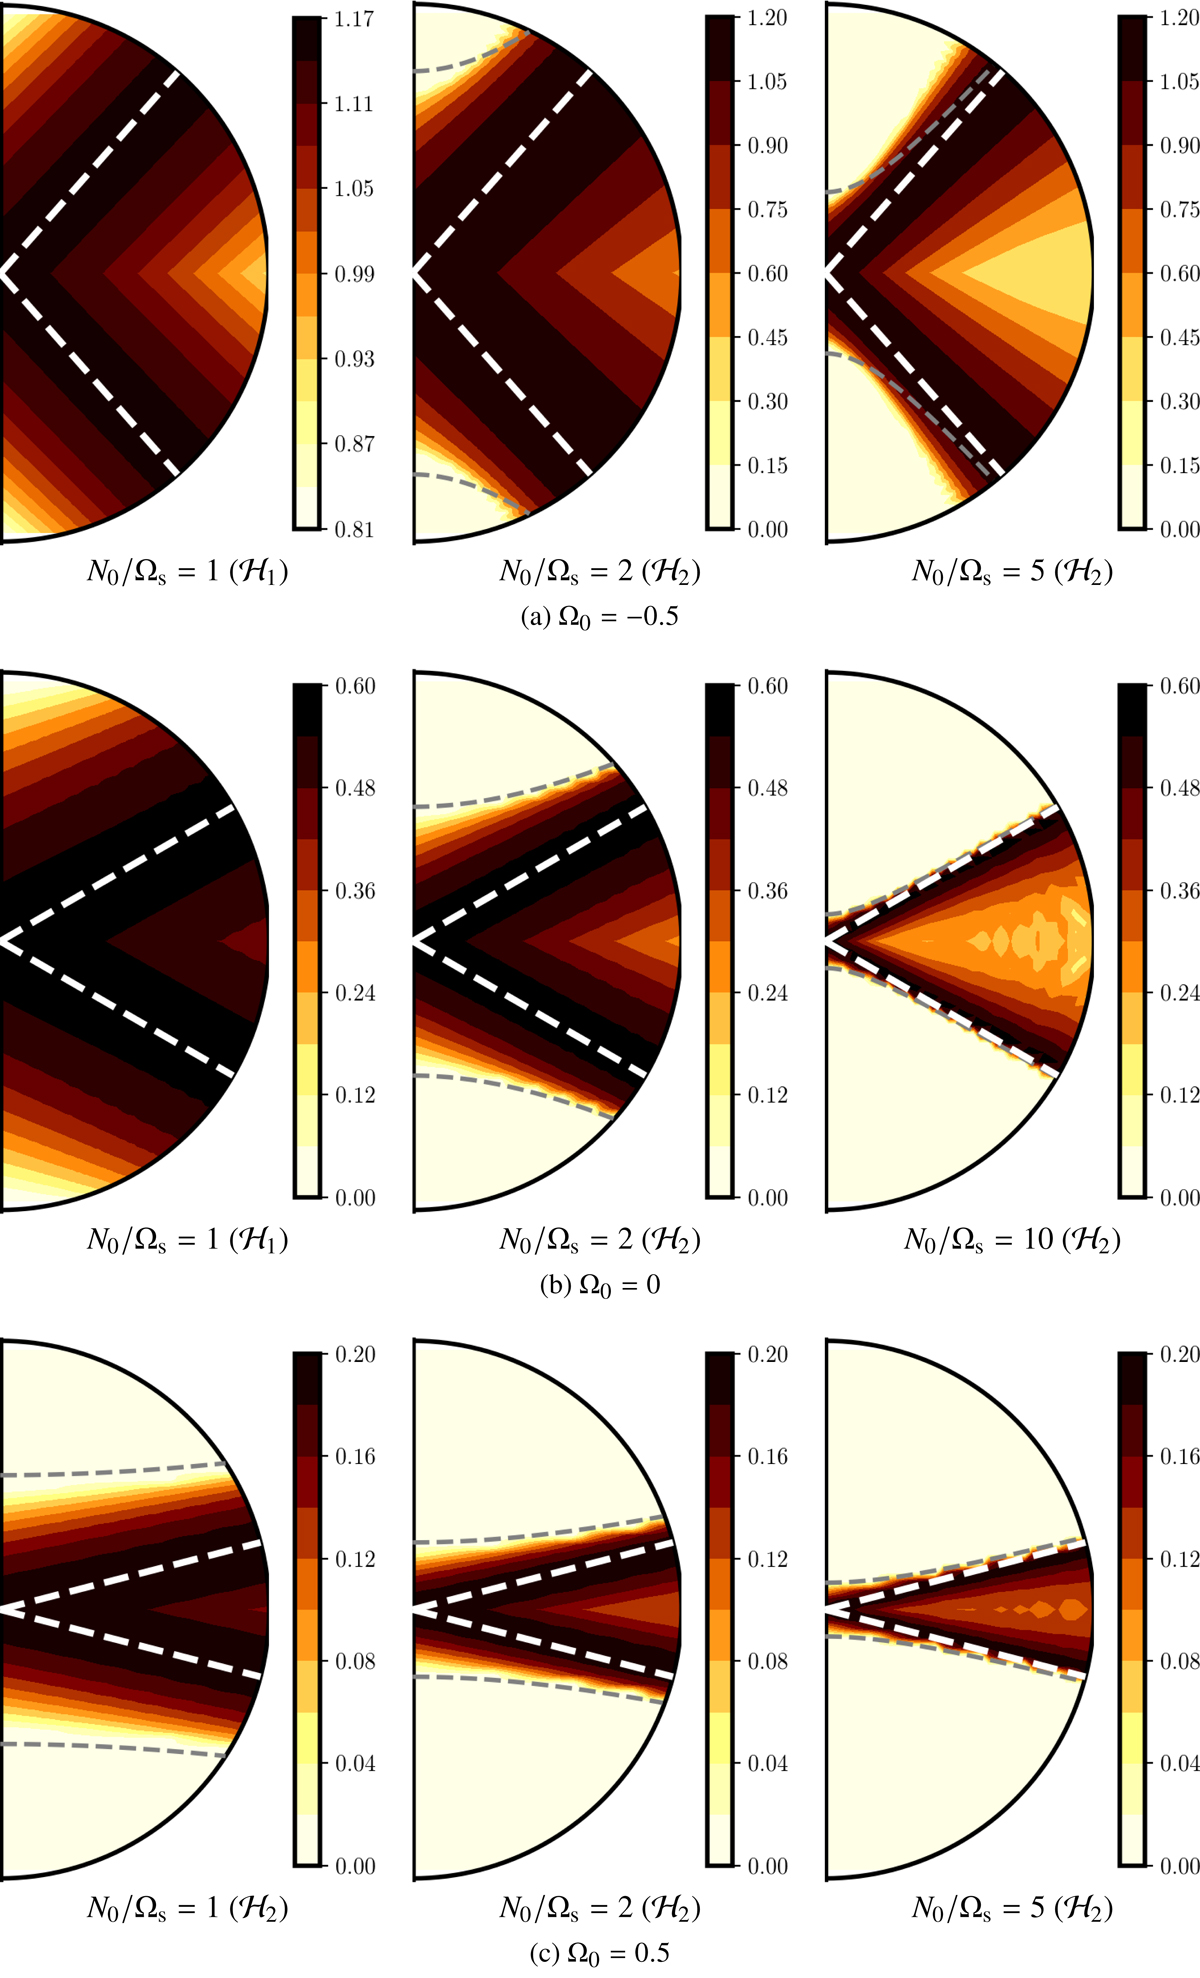
Largest normalised growth rate σ/β0 for several configurations, computed with SWAN for equatorial ellipticity β0 = 0.2. Visualisations in a meridional section using the normalised axes x/a and z/c, with ![]() ,
, ![]() , and c = 1/(ab). White dashed lines, given by formula (18), show the critical latitudes on which the growth rate is maximum as predicted by (24). For each case, the type of waves involved in parametric mechanism is specified between brackets. Dashed (grey) curves illustrate the domain of existence of ℋ2 waves at the resonance (in the regime β0 ≪ 1).
, and c = 1/(ab). White dashed lines, given by formula (18), show the critical latitudes on which the growth rate is maximum as predicted by (24). For each case, the type of waves involved in parametric mechanism is specified between brackets. Dashed (grey) curves illustrate the domain of existence of ℋ2 waves at the resonance (in the regime β0 ≪ 1).
Current usage metrics show cumulative count of Article Views (full-text article views including HTML views, PDF and ePub downloads, according to the available data) and Abstracts Views on Vision4Press platform.
Data correspond to usage on the plateform after 2015. The current usage metrics is available 48-96 hours after online publication and is updated daily on week days.
Initial download of the metrics may take a while.