Fig. 5.
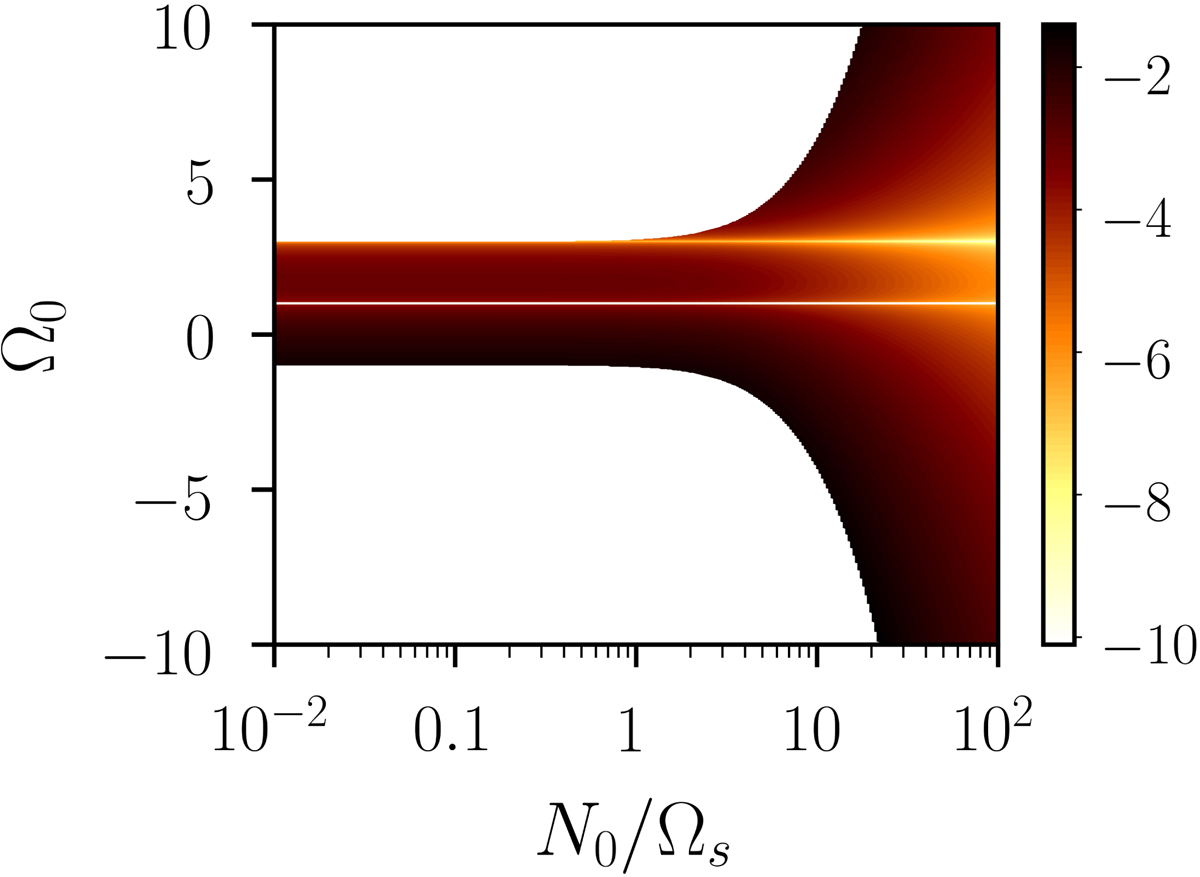
Growth rate σ of tidal instability, predicted by formula (23) in equatorial plane (x0 = 0.5, z0 = 0), as a function of N0/Ωs and Ω0. Colour bar shows the normalised ratio log10(σ/β0). White areas correspond to marginally stable areas. For neutral fluids, tidal instability is restricted to the allowable range −1 ≤ Ω0 ≤ 3 when β0 ≪ 1. When Ω0 = 1 (horizontal white line), the basic state is synchronised (see Appendix D).
Current usage metrics show cumulative count of Article Views (full-text article views including HTML views, PDF and ePub downloads, according to the available data) and Abstracts Views on Vision4Press platform.
Data correspond to usage on the plateform after 2015. The current usage metrics is available 48-96 hours after online publication and is updated daily on week days.
Initial download of the metrics may take a while.