Fig. A.1
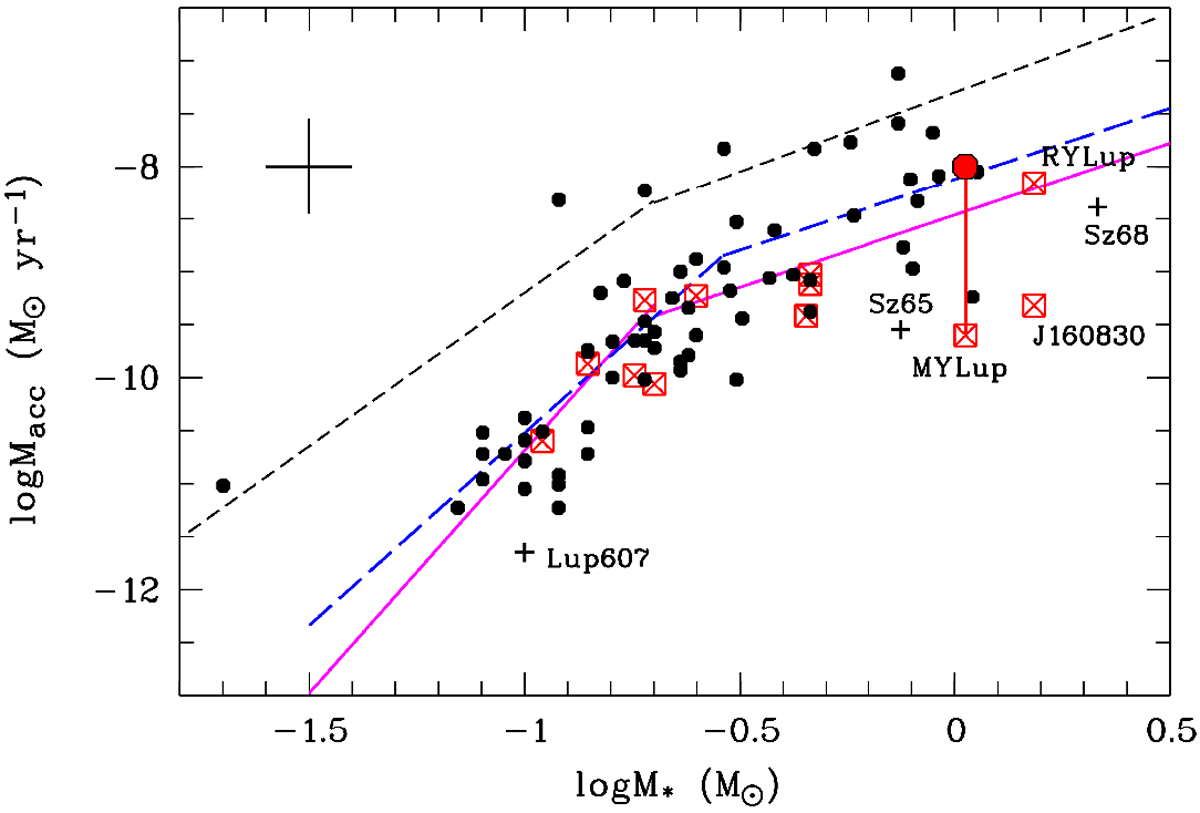
Mass accretion rate as a function of stellar mass for the Lupus sample of Alcalá et al. (2017) after revisiting the stellar and accretion parameters adopting the Gaia DR2 distances. The transitional discs are shown with red crossed squares. The average errors in log M⋆ and log Ṁacc are shown in the upper left. The symbols corresponding to MY Lup, SST c2dJ160830.7-382 827 and RY Lup, the latter also investigated with HST (Arulanantham et al. 2018), are labelled. The big red dot represents the corrected value of Ṁacc for the former, with the vertical red line indicating the corresponding vertical shift. The other three objects classified as weak ornegligible accretors (see Sect. 1) are plotted with plus symbols and are also labelled. Sub-luminous objects are not plotted. The black dashed line shows the double power law theoretically predicted by Vorobyov & Basu (2009), and the continuous magenta lines represent the fits to the data as in Eqs. (4) and (5) of Alcalá et al. (2017); the long-dashed blue line shows the robust double-linear fit following the prescription by Manara et al. (2017a).
Current usage metrics show cumulative count of Article Views (full-text article views including HTML views, PDF and ePub downloads, according to the available data) and Abstracts Views on Vision4Press platform.
Data correspond to usage on the plateform after 2015. The current usage metrics is available 48-96 hours after online publication and is updated daily on week days.
Initial download of the metrics may take a while.