Free Access
Fig. 7
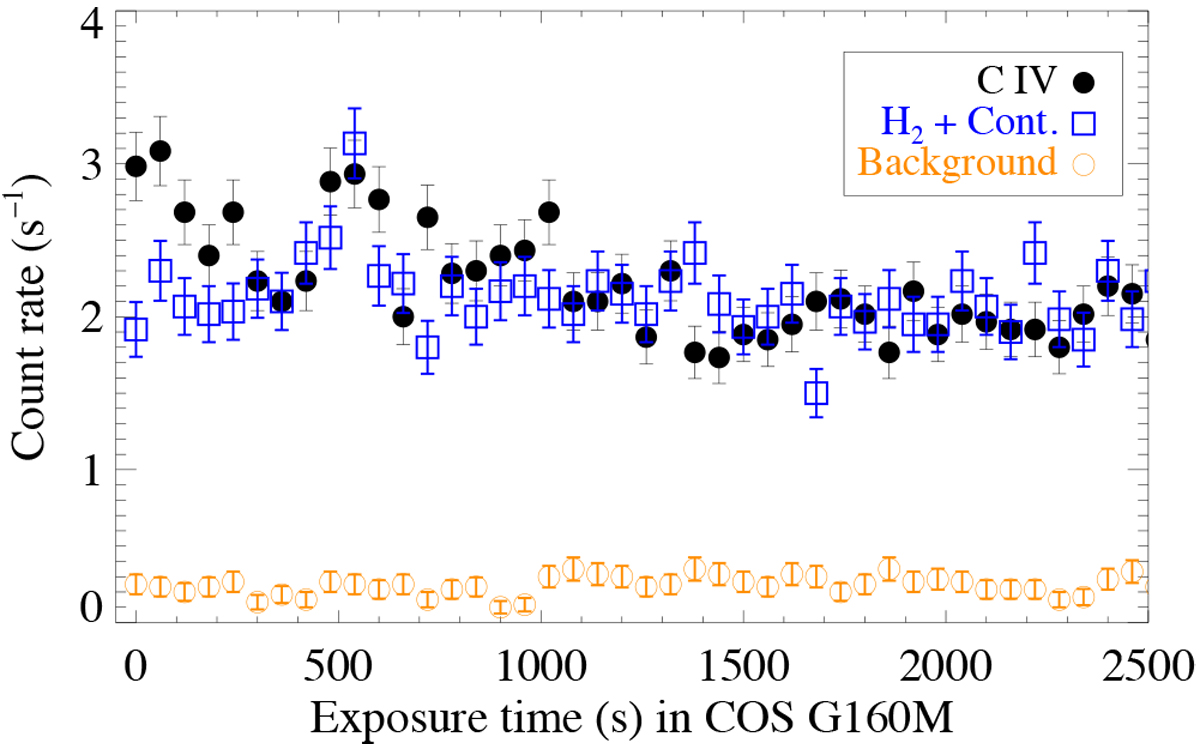
Far-ultraviolet light curves for a few relevant lines related to a possible flare and Ly-α-driven fluorescence.The C IV region was integrated over 1544–1556 Å and the H2 region was integrated over 1488–1526 Å. The total integration time was 2592 s and the temporal cadence in the plots is 60 s per time step.
Current usage metrics show cumulative count of Article Views (full-text article views including HTML views, PDF and ePub downloads, according to the available data) and Abstracts Views on Vision4Press platform.
Data correspond to usage on the plateform after 2015. The current usage metrics is available 48-96 hours after online publication and is updated daily on week days.
Initial download of the metrics may take a while.