Fig. 5
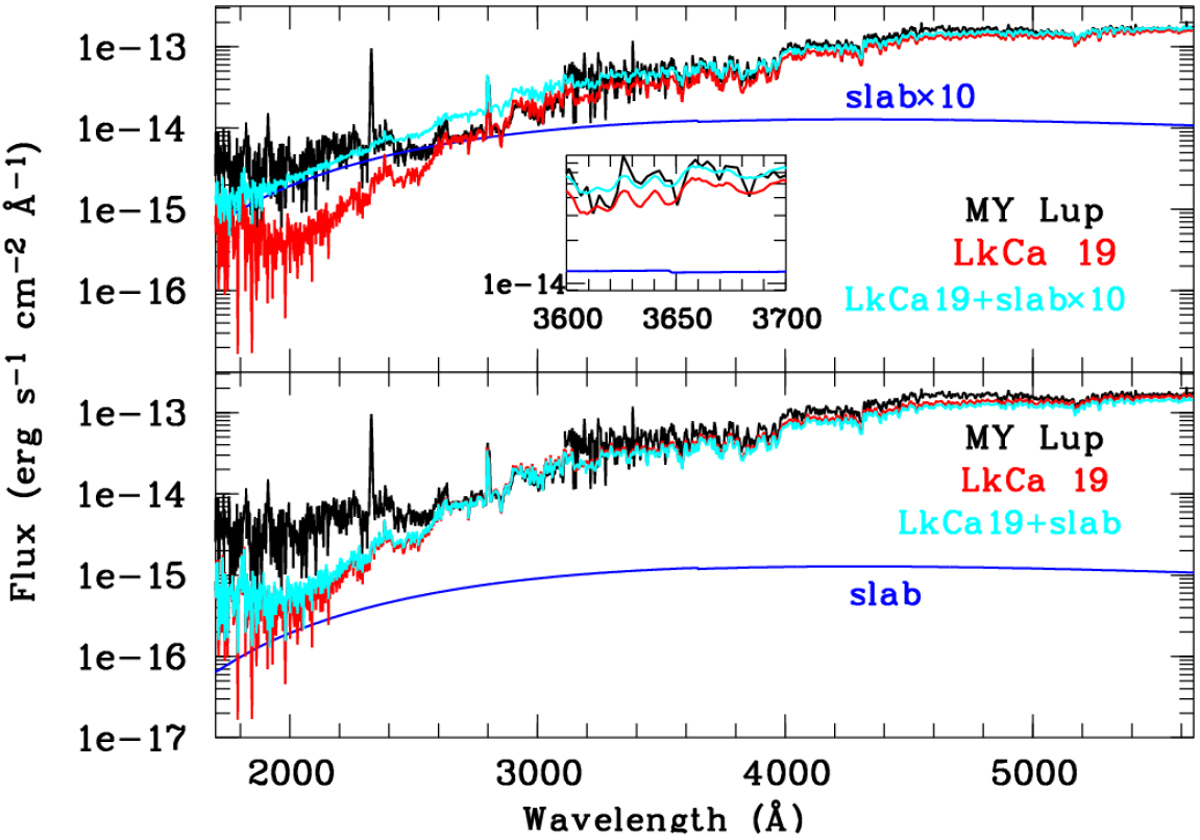
Lower panel: extinction corrected HST NUV and STIS spectra of MY Lup (black) and LkCa 19 (red). The slab model derived in Alcalá et al. (2017) is also shown (blue). The cyan spectrum shows the sum of LkCa 19 plus the slab. Upper panel: same as in lower panel, but with the slab model multiplied by ten. We note the tiny Balmer Jump shown in the inset.
Current usage metrics show cumulative count of Article Views (full-text article views including HTML views, PDF and ePub downloads, according to the available data) and Abstracts Views on Vision4Press platform.
Data correspond to usage on the plateform after 2015. The current usage metrics is available 48-96 hours after online publication and is updated daily on week days.
Initial download of the metrics may take a while.