Free Access
Fig. 2
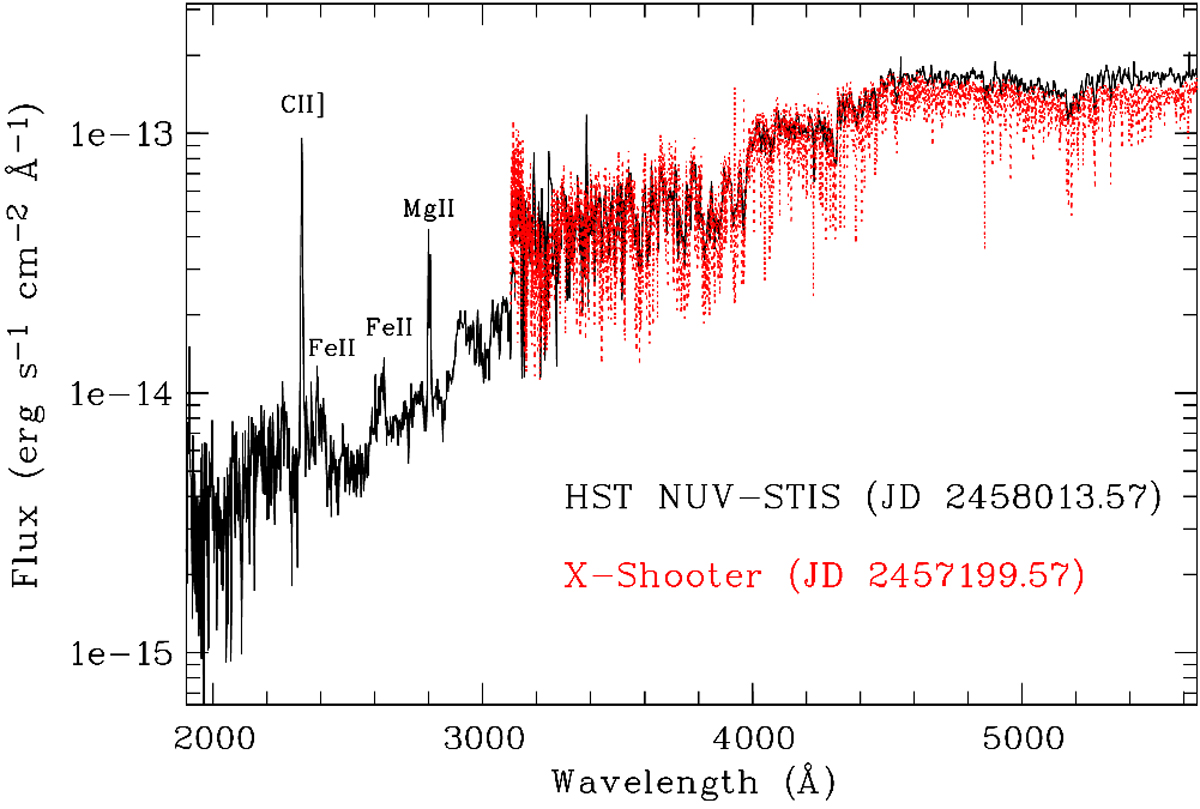
Hubble Space Telescope NUV and STIS spectra of MY Lup are shown as the black continuous line. The red dotted line represents the X-shooter spectrum acquired more than 2 yr earlier as indicated by the JD in the labels. The spectra are corrected for reddening as described in the text.
Current usage metrics show cumulative count of Article Views (full-text article views including HTML views, PDF and ePub downloads, according to the available data) and Abstracts Views on Vision4Press platform.
Data correspond to usage on the plateform after 2015. The current usage metrics is available 48-96 hours after online publication and is updated daily on week days.
Initial download of the metrics may take a while.