Fig. C.2.
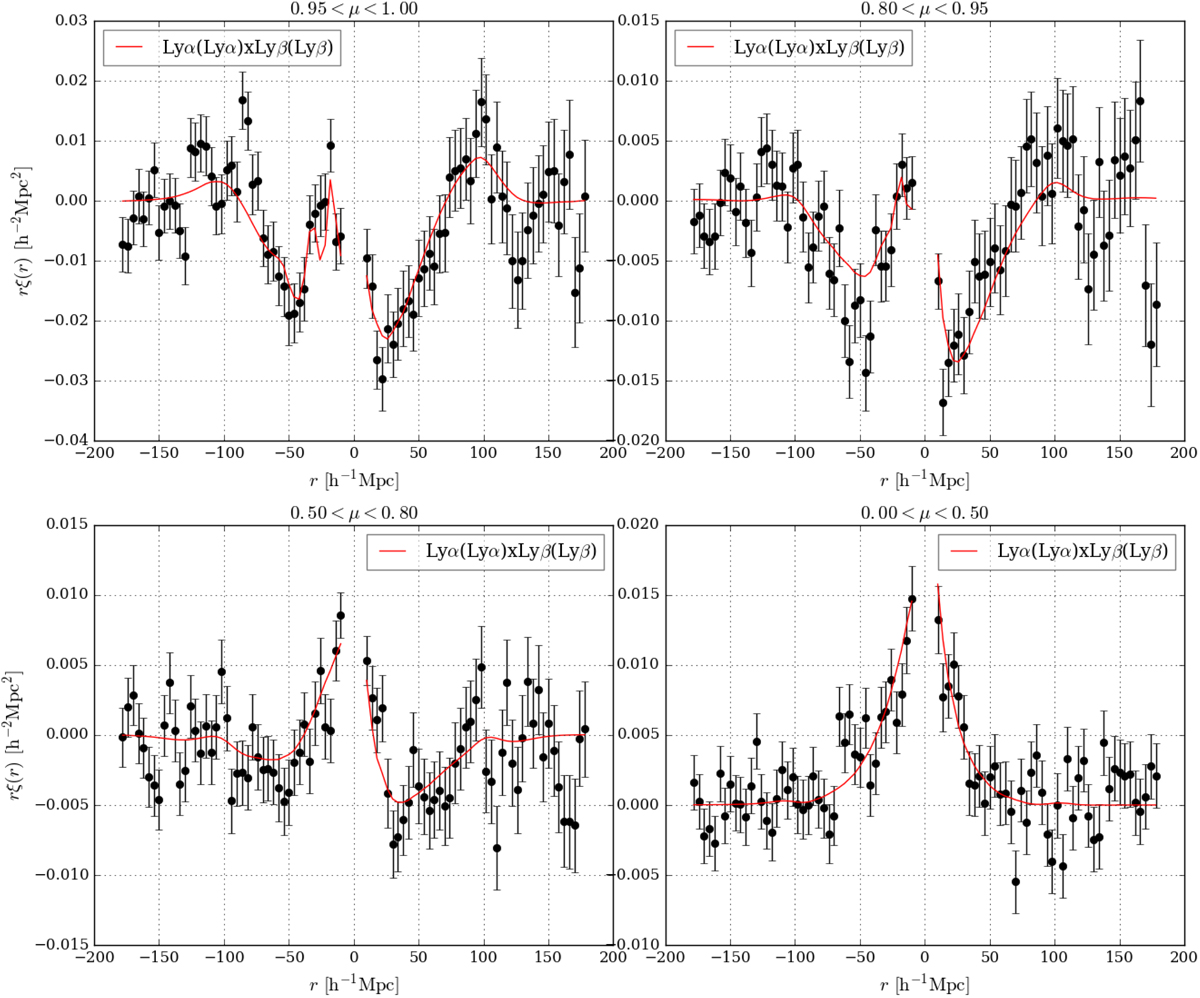
Measured Lyα(Lyα) × Lyβ(Lyβ) correlation function in four ranges of μ. In order to see the asymmetry of this correlation function, ![]() is multiplied by the sign of r∥ which is positive if the Lyα absorber is farther than the Lyβ absorber, and negative in the opposite configuration. The model for this correlation function (red solid line) is fitted on Lyα(Lyα) × Lyα(Lyα), Lyα(Lyα) × Lyα(Lyβ) and Lyα(Lyα) × Lyβ(Lyβ).
is multiplied by the sign of r∥ which is positive if the Lyα absorber is farther than the Lyβ absorber, and negative in the opposite configuration. The model for this correlation function (red solid line) is fitted on Lyα(Lyα) × Lyα(Lyα), Lyα(Lyα) × Lyα(Lyβ) and Lyα(Lyα) × Lyβ(Lyβ).
Current usage metrics show cumulative count of Article Views (full-text article views including HTML views, PDF and ePub downloads, according to the available data) and Abstracts Views on Vision4Press platform.
Data correspond to usage on the plateform after 2015. The current usage metrics is available 48-96 hours after online publication and is updated daily on week days.
Initial download of the metrics may take a while.