Fig. B.3.
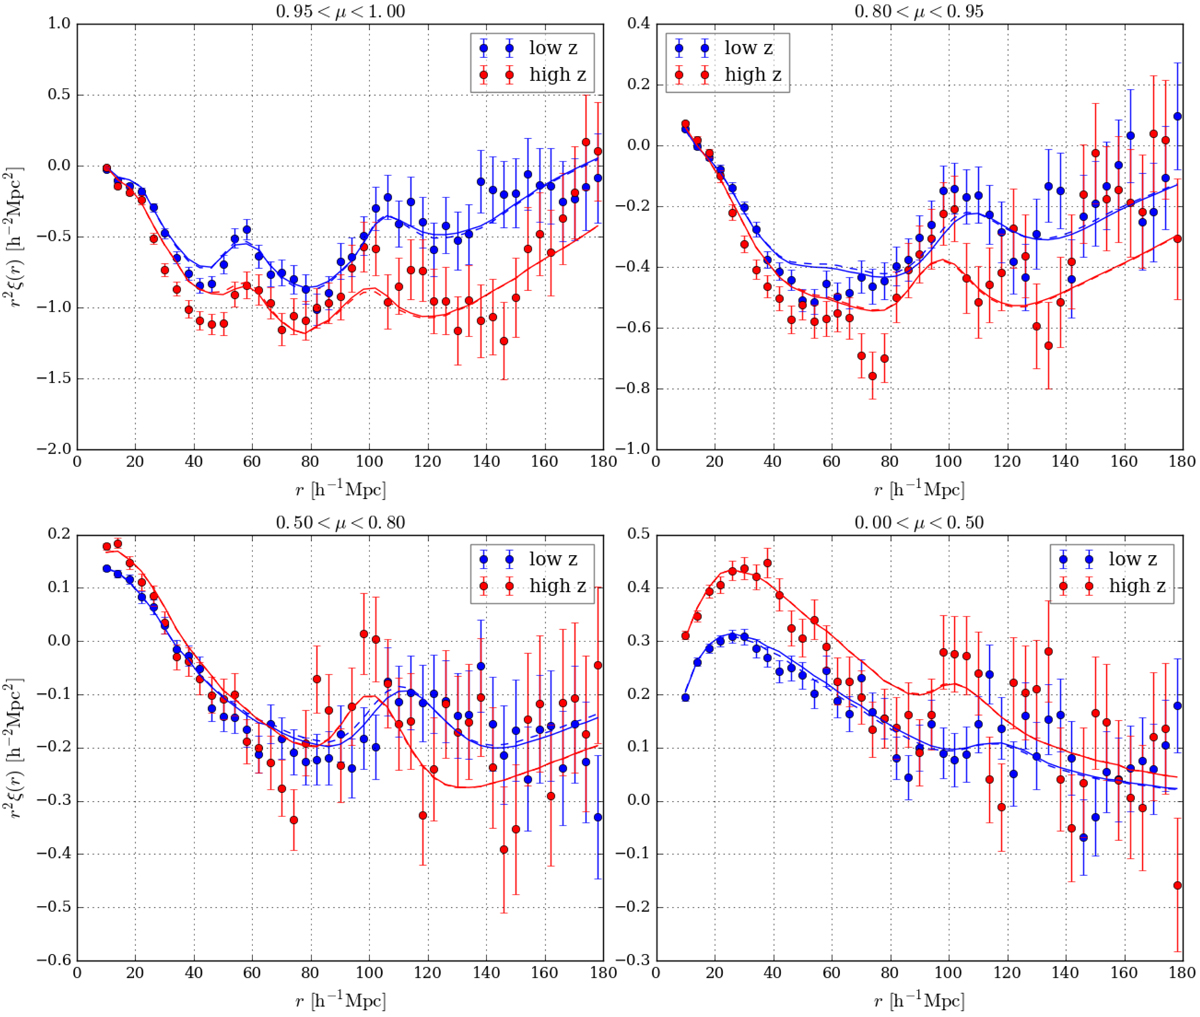
Lyα(Lyα) × Lyα(Lyα) function in four ranges of μ = r∥/r values, computed in a low-redshift (blue dots) and in a high-redshift (red dots) bin obtained by splitting our sample so that the two bins have equivalent statistical power. The dashed lines correspond to the simple fits to the data of the Lyα(Lyα) × Lyα(Lyα) correlation function, the solid line to the combining fits to the data of the Lyα(Lyα) × Lyα(Lyα) and Lyα(Lyα) × Lyα(Lyβ) correlation functions.
Current usage metrics show cumulative count of Article Views (full-text article views including HTML views, PDF and ePub downloads, according to the available data) and Abstracts Views on Vision4Press platform.
Data correspond to usage on the plateform after 2015. The current usage metrics is available 48-96 hours after online publication and is updated daily on week days.
Initial download of the metrics may take a while.