Open Access
Fig. B.2.
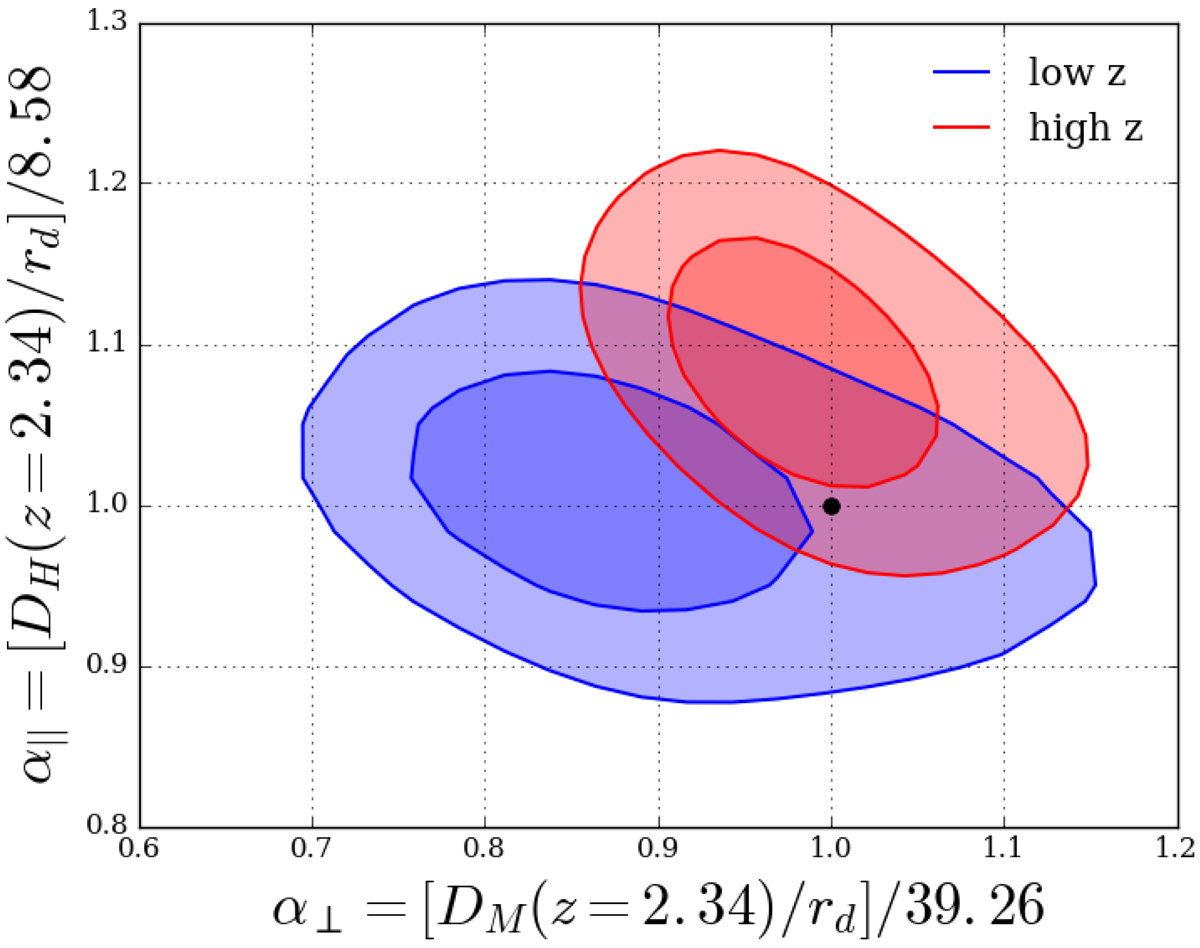
68% and 95% confidence level contours in the (α∥, α⊥) plane from the Lyα(Lyα) × Lyα(Lyα) computed with the low- and high-redshift bins. The Δχ2 values corresponding to confidence levels are taken from Table D.1. The black dot corresponds to the Pl2015 model.
Current usage metrics show cumulative count of Article Views (full-text article views including HTML views, PDF and ePub downloads, according to the available data) and Abstracts Views on Vision4Press platform.
Data correspond to usage on the plateform after 2015. The current usage metrics is available 48-96 hours after online publication and is updated daily on week days.
Initial download of the metrics may take a while.