Fig. 16.
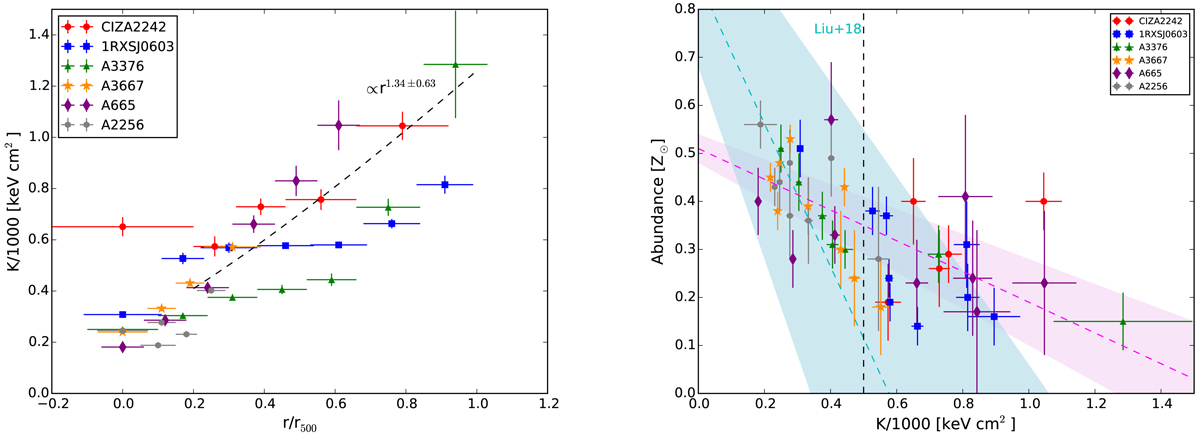
Left panel: pseudo-entropy distribution scaled by r500. Right panel: distribution of Fe abundance versus the scaled pseudo-entropy of all the measured regions of the clusters: CIZA2242, 1RXSJ0603, A3376, A3667, A665 and A2256. The magenta dashed line is the best-fit linear model and the shaded area shows the 1σ uncertainties of the best-fit parameter. The cyan line and shadow are the results of Liu et al. (2018) for relaxed galaxy clusters.
Current usage metrics show cumulative count of Article Views (full-text article views including HTML views, PDF and ePub downloads, according to the available data) and Abstracts Views on Vision4Press platform.
Data correspond to usage on the plateform after 2015. The current usage metrics is available 48-96 hours after online publication and is updated daily on week days.
Initial download of the metrics may take a while.