Fig. 12.
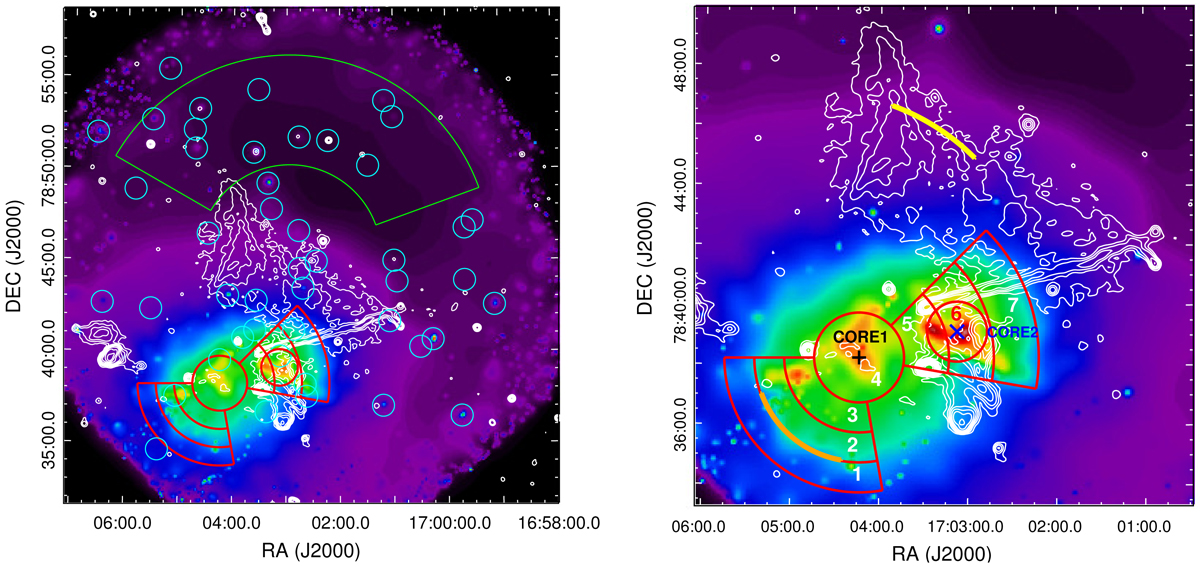
Left panel: XMM-Newton smoothed image in the 0.3−10 keV band of A2256. The red sectors represent the regions used for the temperature and abundance distributions. The green sector is the offset region used for the sky background estimation. Cyan circles are the point sources removed, with enlarged radius for clarity purpose. White contours are WRST radio contours. Right panel: enlarged image of A2256. The CORE1 and CORE2 are marked with a black and blue crosses, respectively. The solid yellow and orange lines show the X-ray shocks and cold front position. The numbers label the regions used in the spectral fitting.
Current usage metrics show cumulative count of Article Views (full-text article views including HTML views, PDF and ePub downloads, according to the available data) and Abstracts Views on Vision4Press platform.
Data correspond to usage on the plateform after 2015. The current usage metrics is available 48-96 hours after online publication and is updated daily on week days.
Initial download of the metrics may take a while.