Fig. 8
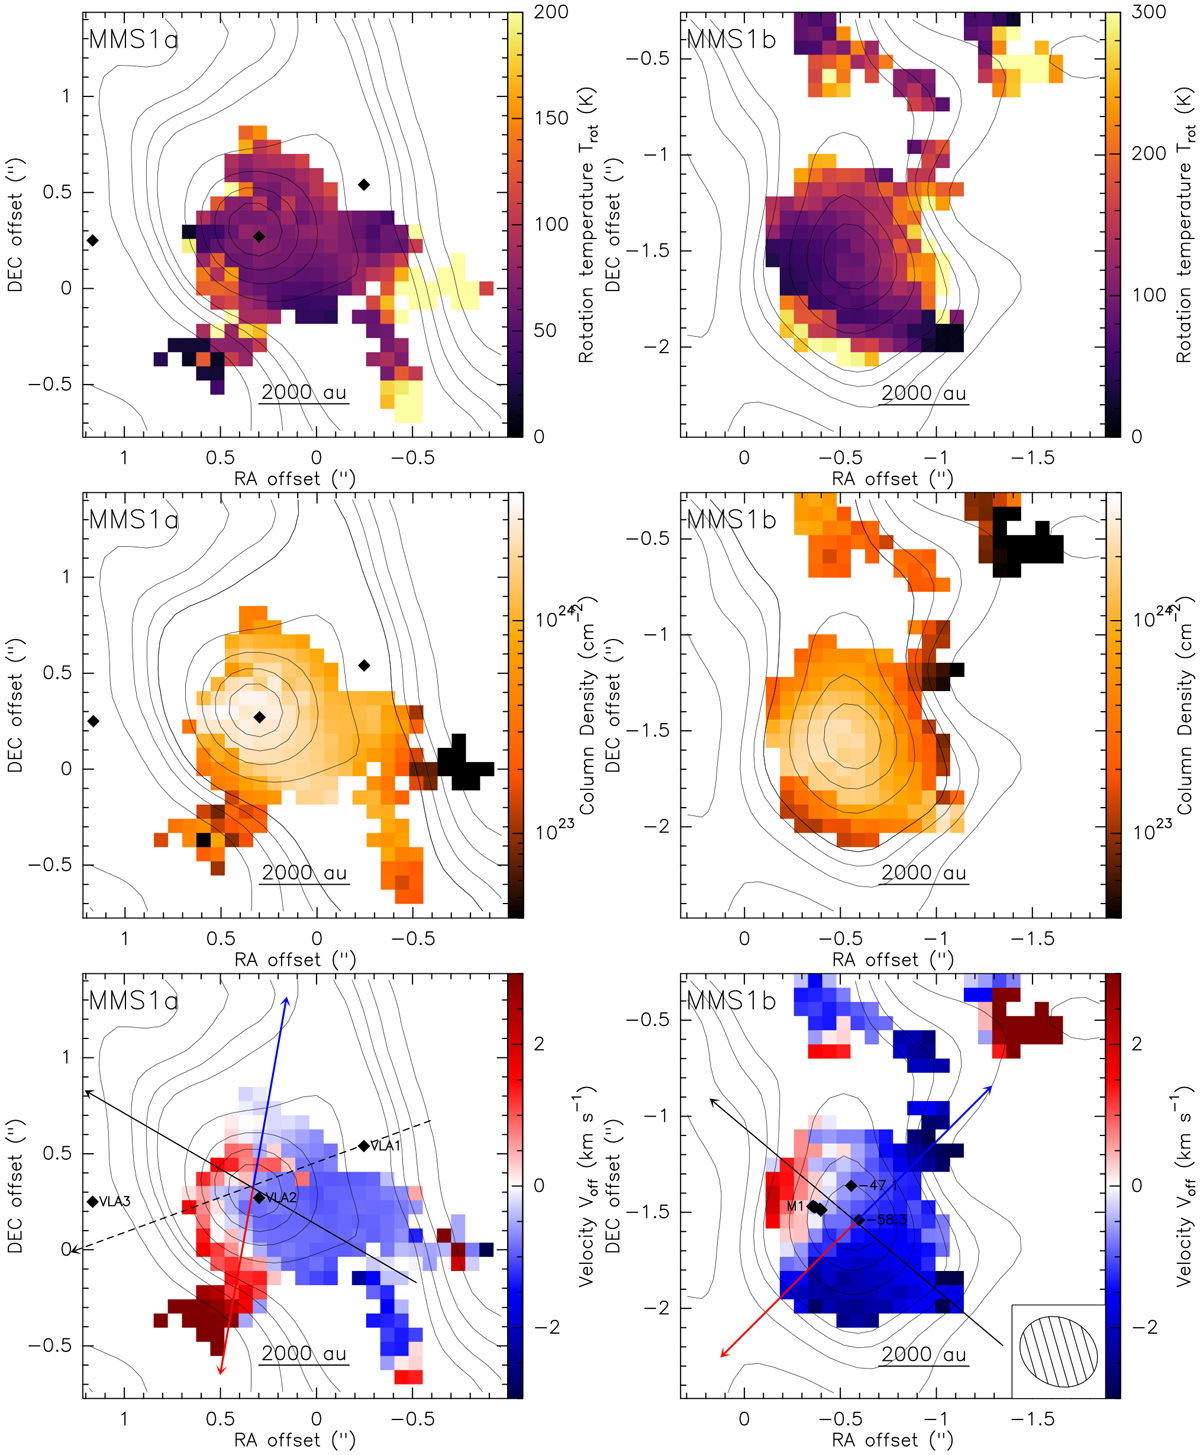
Results of the radiative transfer modeling with XCLASS of the CH3CN (12K – 11K, K = 0– 6) data. The maps cover 2.2′′ × 2.2′′ extracted around the two major cores MMS1a and b, where pixels with flux below
![]() were blanked out. The black contours indicate the 5, 10, 15, 20σ continuum emission levels and increase further in steps of 20σ, where σ = 0.28 mJy beam−1. The black diamonds in the MMS1a panel mark the positions of the emission peaks at 3.6 cm (Rodríguez et al. 2012). The shaded ellipse in the lower right corner indicates the synthesized beam of the CH3 CN data of 0.42′′ × 0.35′′ (PA 61°). Details to the spectral line map fit are summarized in Sect. 3.5. Top: rotational temperature maps from XCLASS. Middle: H2 column density maps, estimated from the continuum intensity Iν (Fig. 1), and rotational temperature Trot (top panels) using Eq. (2). Bottom: velocity offsets from XCLASS. The colors indicate the relative velocity with respect to the vLSR = −53.1 km s−1. In the MMS1b panel, the additional black diamonds mark the positions of the H2 O masers with the corresponding velocity in km s−1 from Rodríguez et al. (2012). The M1 maser group contains maser emission with velocities ranging from − 37.2 to − 66.8 km s−1. The blue and red arrows are the outflow axes as in Fig. 6. The solid and dashed black arrows are the cut directions for the PV diagrams presented in Fig. 9, along the presumable disk semi-major axes.
were blanked out. The black contours indicate the 5, 10, 15, 20σ continuum emission levels and increase further in steps of 20σ, where σ = 0.28 mJy beam−1. The black diamonds in the MMS1a panel mark the positions of the emission peaks at 3.6 cm (Rodríguez et al. 2012). The shaded ellipse in the lower right corner indicates the synthesized beam of the CH3 CN data of 0.42′′ × 0.35′′ (PA 61°). Details to the spectral line map fit are summarized in Sect. 3.5. Top: rotational temperature maps from XCLASS. Middle: H2 column density maps, estimated from the continuum intensity Iν (Fig. 1), and rotational temperature Trot (top panels) using Eq. (2). Bottom: velocity offsets from XCLASS. The colors indicate the relative velocity with respect to the vLSR = −53.1 km s−1. In the MMS1b panel, the additional black diamonds mark the positions of the H2 O masers with the corresponding velocity in km s−1 from Rodríguez et al. (2012). The M1 maser group contains maser emission with velocities ranging from − 37.2 to − 66.8 km s−1. The blue and red arrows are the outflow axes as in Fig. 6. The solid and dashed black arrows are the cut directions for the PV diagrams presented in Fig. 9, along the presumable disk semi-major axes.
Current usage metrics show cumulative count of Article Views (full-text article views including HTML views, PDF and ePub downloads, according to the available data) and Abstracts Views on Vision4Press platform.
Data correspond to usage on the plateform after 2015. The current usage metrics is available 48-96 hours after online publication and is updated daily on week days.
Initial download of the metrics may take a while.