Fig. 5
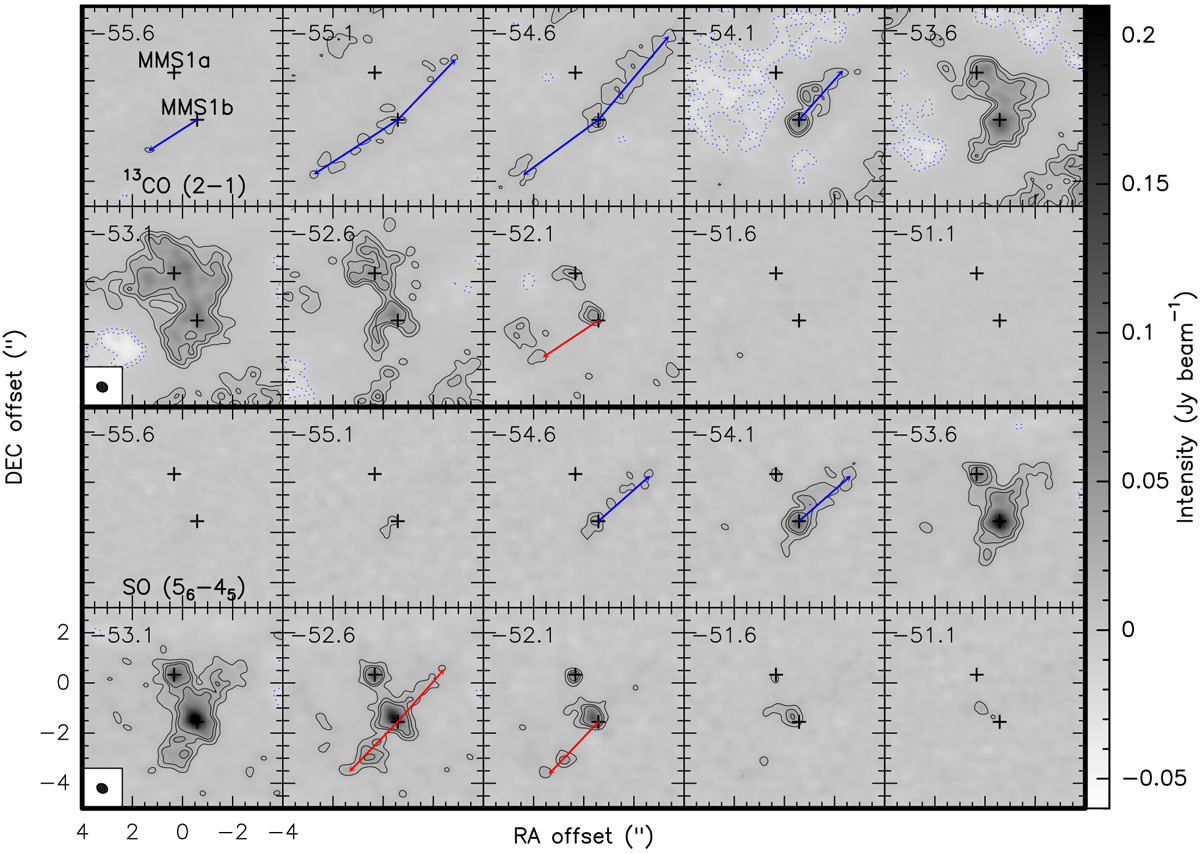
Channel maps of 13CO (2–1, top panels) and SO (56–45, bottom panels) emission in the interferometric data. The black contours are the 5, 10, and 15σ levels for the respective molecule, and the blue dotted contours are the corresponding negative values. The black + signs mark the position of the mm emission peaks of MMS1a and b. The blue and red arrows guide the eye to the direction of the respective Doppler-shifted emission. The shaded ellipse in the lower left corners indicate the synthesized beam of 0.44′′ × 0.36′′ (PA 61°) for both data cubes.
Current usage metrics show cumulative count of Article Views (full-text article views including HTML views, PDF and ePub downloads, according to the available data) and Abstracts Views on Vision4Press platform.
Data correspond to usage on the plateform after 2015. The current usage metrics is available 48-96 hours after online publication and is updated daily on week days.
Initial download of the metrics may take a while.