Fig. A.3
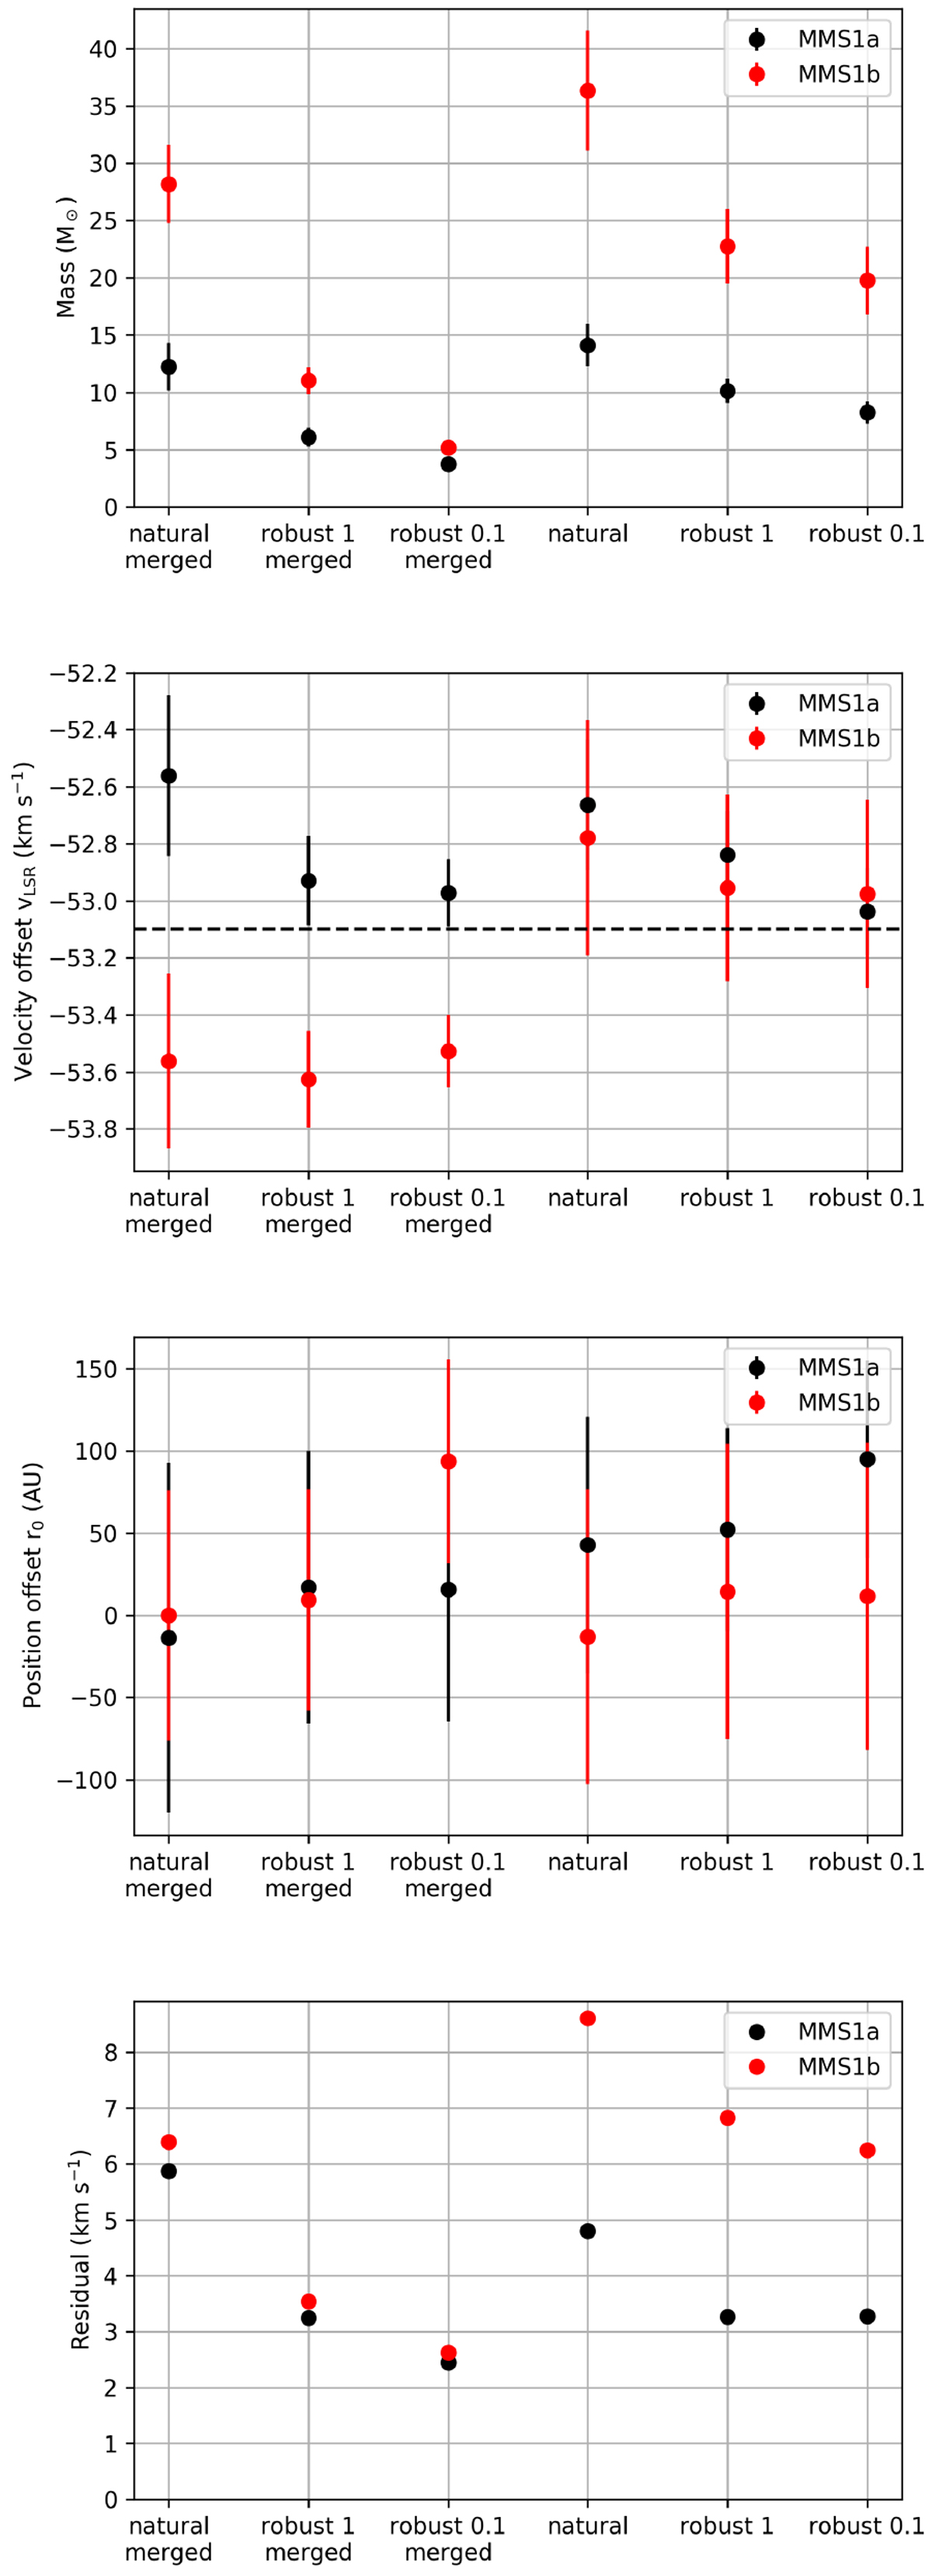
Best-fit results for PV diagrams from different weighting schemes. The results are presented for three weighting parameters of the merged data set and for the interferometric data. Within both series, the weighting schemes are natural, robust with a weight threshold of 1 and robust with a weight threshold of 0.1 (uniform); see Table A.1. The error bars are the standard deviations from the least-squares fits. The horizontal line in the velocity plot is the systemic velocity of the source IRAS 23033+5951.
Current usage metrics show cumulative count of Article Views (full-text article views including HTML views, PDF and ePub downloads, according to the available data) and Abstracts Views on Vision4Press platform.
Data correspond to usage on the plateform after 2015. The current usage metrics is available 48-96 hours after online publication and is updated daily on week days.
Initial download of the metrics may take a while.