Fig. 8
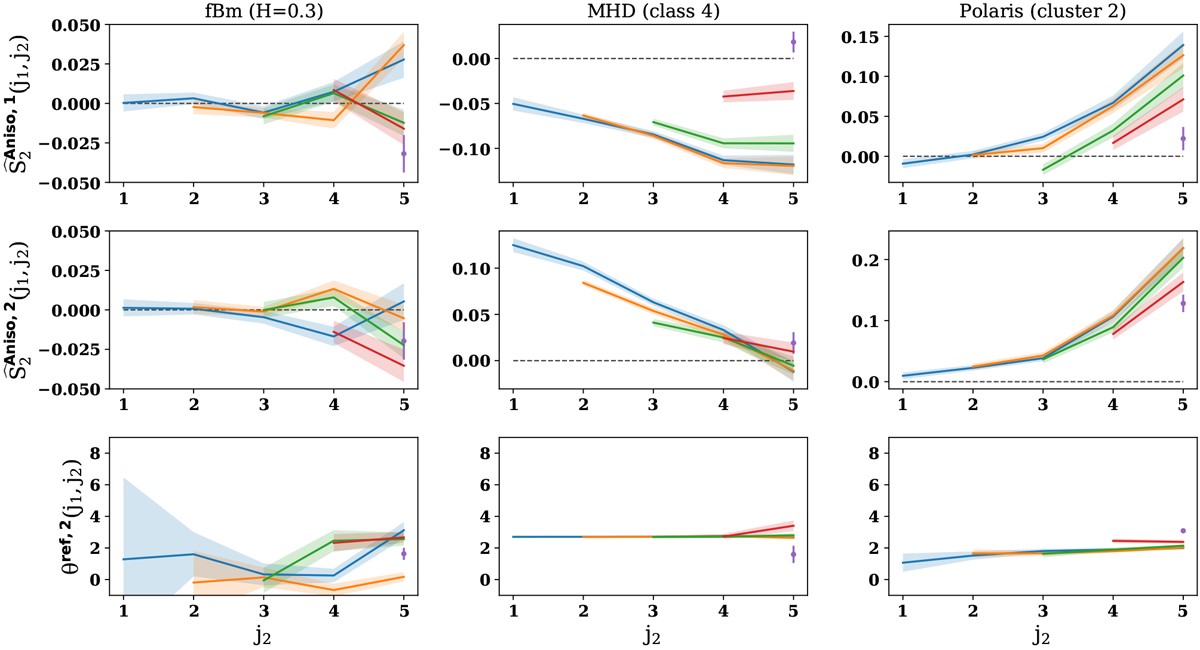
![]() ,
,
![]() , and associated θref,2(j1, j2) terms of the RWST. First column: H = 0.3 fBm processes. Second column: MHD simulations of the fourth described class. Third column: first clustered area of the Herschel Polaris observation (see Appendix B for more detail). Each curve has a fixed
j1 values, following the convention given in Fig. 7, and j2
values going from j1 + 1 to 5.
, and associated θref,2(j1, j2) terms of the RWST. First column: H = 0.3 fBm processes. Second column: MHD simulations of the fourth described class. Third column: first clustered area of the Herschel Polaris observation (see Appendix B for more detail). Each curve has a fixed
j1 values, following the convention given in Fig. 7, and j2
values going from j1 + 1 to 5.
Current usage metrics show cumulative count of Article Views (full-text article views including HTML views, PDF and ePub downloads, according to the available data) and Abstracts Views on Vision4Press platform.
Data correspond to usage on the plateform after 2015. The current usage metrics is available 48-96 hours after online publication and is updated daily on week days.
Initial download of the metrics may take a while.