Open Access
Fig. 7
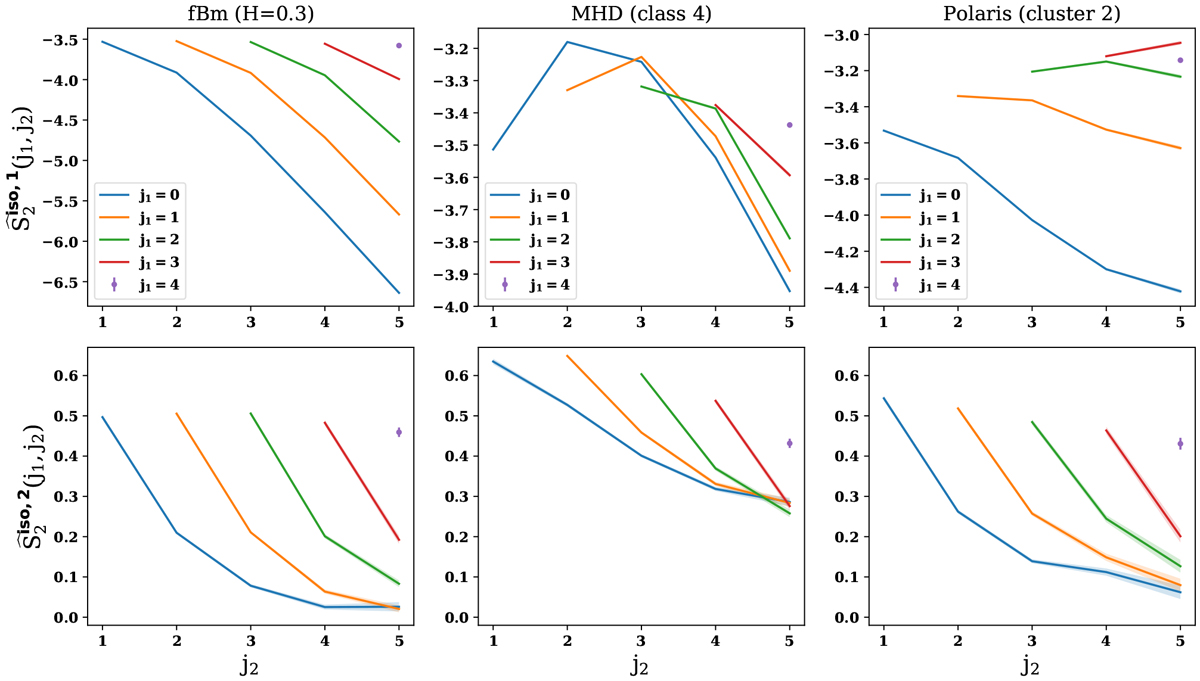
![]() (top row) and
(top row) and ![]() (bottom row). First column: case of a H = 0.3 fBm process. Second column: MHD simulation (class 4). Third column: first cluster of the Herschel Polaris Flare observation. Each curve corresponds to a fixed
j1 value, and j2
values ranging from j1 + 1 to 5.
(bottom row). First column: case of a H = 0.3 fBm process. Second column: MHD simulation (class 4). Third column: first cluster of the Herschel Polaris Flare observation. Each curve corresponds to a fixed
j1 value, and j2
values ranging from j1 + 1 to 5.
Current usage metrics show cumulative count of Article Views (full-text article views including HTML views, PDF and ePub downloads, according to the available data) and Abstracts Views on Vision4Press platform.
Data correspond to usage on the plateform after 2015. The current usage metrics is available 48-96 hours after online publication and is updated daily on week days.
Initial download of the metrics may take a while.