Open Access
Fig. 6
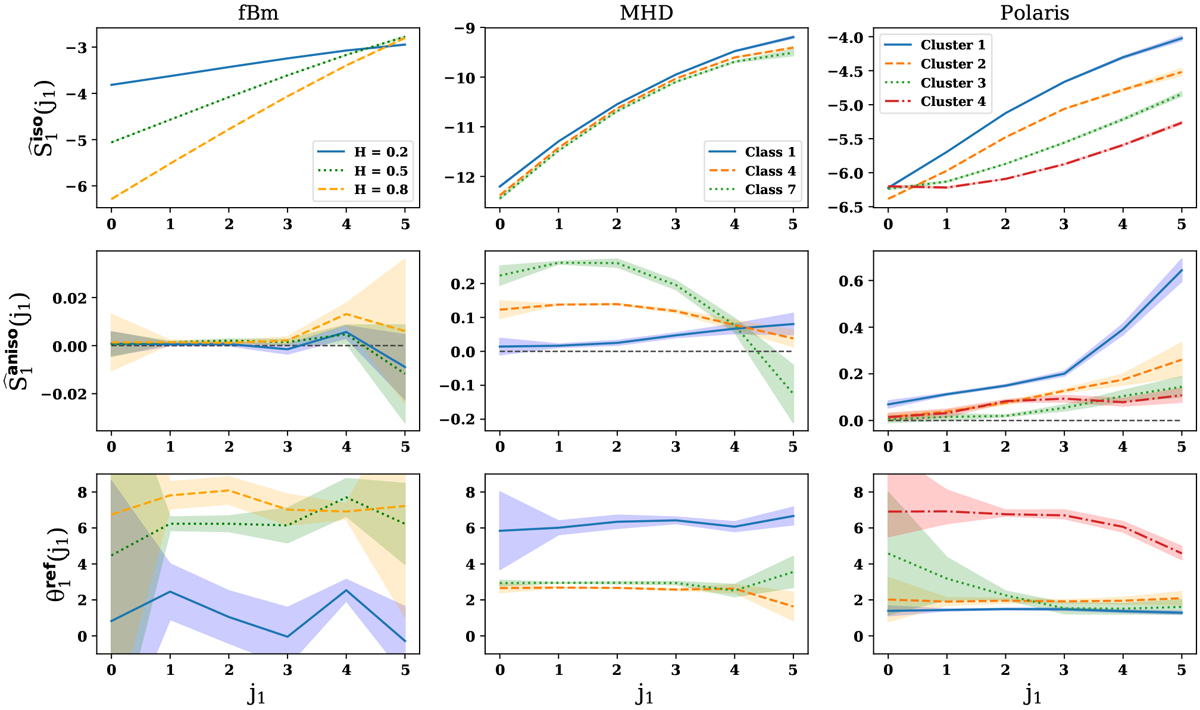
Plots of ![]() (top row),
(top row), ![]() (middle row), and θref,1(j1) (bottom row). First column: case of three fBm processes with different Hurst exponents. Second column: three MHD simulations with different physical parameters. Third column: four clusters of the Herschel Polaris Flare observation.
(middle row), and θref,1(j1) (bottom row). First column: case of three fBm processes with different Hurst exponents. Second column: three MHD simulations with different physical parameters. Third column: four clusters of the Herschel Polaris Flare observation.
Current usage metrics show cumulative count of Article Views (full-text article views including HTML views, PDF and ePub downloads, according to the available data) and Abstracts Views on Vision4Press platform.
Data correspond to usage on the plateform after 2015. The current usage metrics is available 48-96 hours after online publication and is updated daily on week days.
Initial download of the metrics may take a while.