Fig. 5
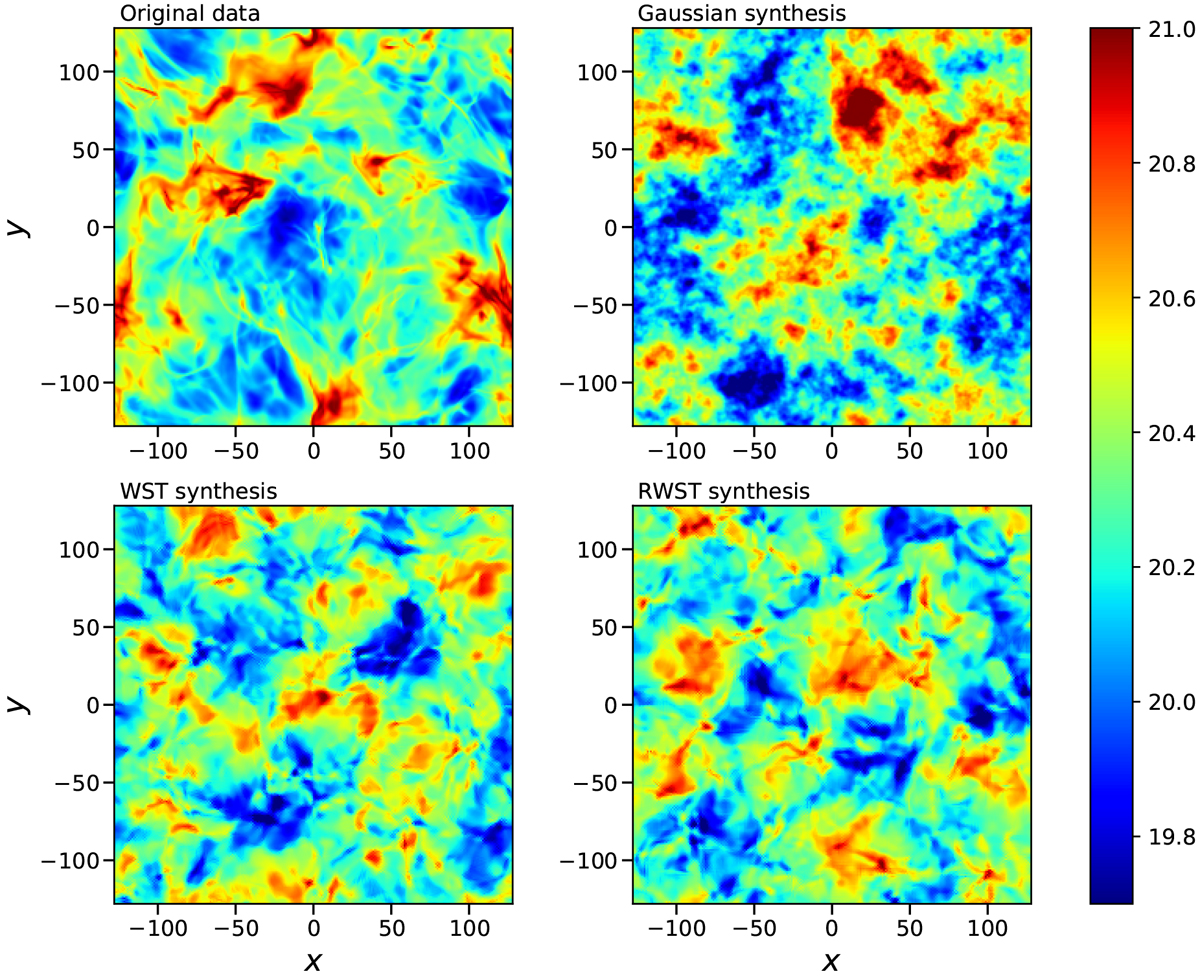
Top left: example of a column density map, in logarithmic scale, from a simulation of interstellarMHD turbulence (class 5, see Appendix B). Top right: synthetic Gaussian random field with the same power spectrum. Bottom left: synthetic random field with the same m = 0, m = 1, and m = 2 WST coefficients. Bottom right: synthetic random field with the same m = 0, m = 1, and m = 2 RWST coefficients.
Current usage metrics show cumulative count of Article Views (full-text article views including HTML views, PDF and ePub downloads, according to the available data) and Abstracts Views on Vision4Press platform.
Data correspond to usage on the plateform after 2015. The current usage metrics is available 48-96 hours after online publication and is updated daily on week days.
Initial download of the metrics may take a while.