Fig. 4
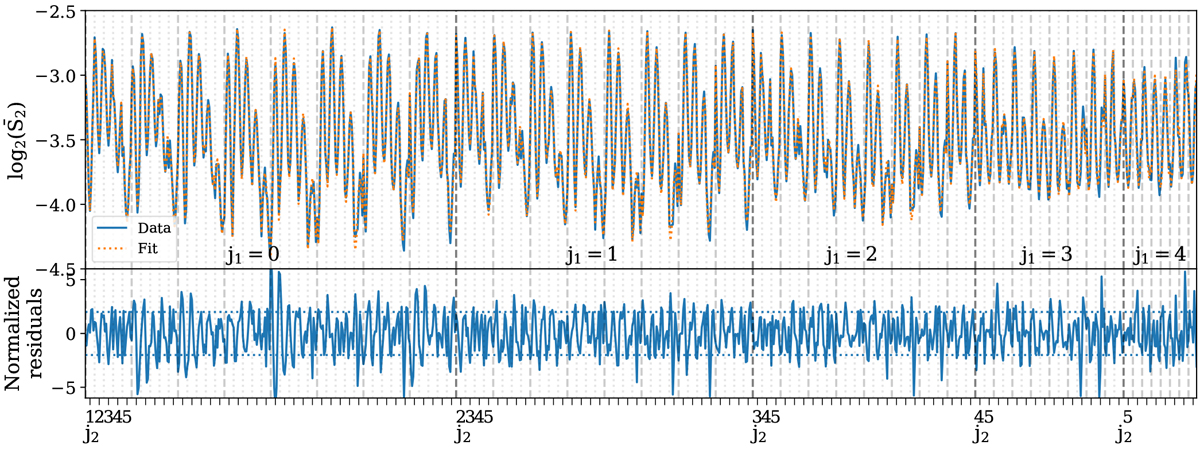
Logarithms of the normalised m = 2 scattering coefficients averaged over twenty 256 × 256 column density maps from an MHD simulation (class 4, see Appendix B). The coefficients are given in lexicographical order (j1, θ1, j2, θ2).
Top panel: fit using Eq. (14) plus additional terms discussed in Appendix C is shown (dashed orange line) on top of the data (solid blue line). The additional terms that have been taken into account in this fit are a lattice signature and a
π∕2 harmonic forthe ![]() term. Bottom panel: residuals normalised to the standard deviation. Dotted lines correspond to
± 2σ.
term. Bottom panel: residuals normalised to the standard deviation. Dotted lines correspond to
± 2σ.
Current usage metrics show cumulative count of Article Views (full-text article views including HTML views, PDF and ePub downloads, according to the available data) and Abstracts Views on Vision4Press platform.
Data correspond to usage on the plateform after 2015. The current usage metrics is available 48-96 hours after online publication and is updated daily on week days.
Initial download of the metrics may take a while.