Fig. 2
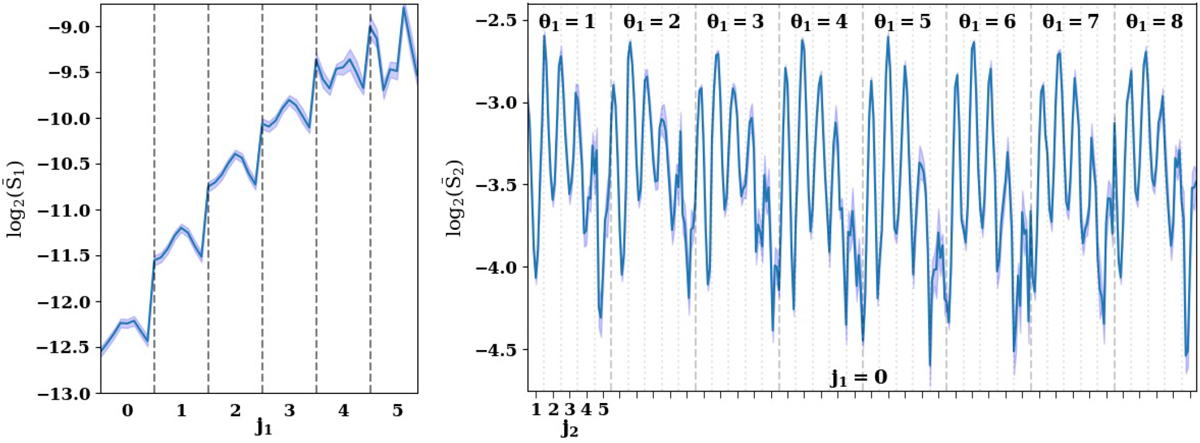
Logarithms of the normalised scattering coefficients of a 256 × 256 column density map from an MHD simulation (class 4, see Appendix B), plotted in a lexicographical order. In the ![]() plot (left), θ1
spans the range 1–8 for each value of j1. In the
plot (left), θ1
spans the range 1–8 for each value of j1. In the ![]() plot (right), θ2
spans the range 1–8 for each value of (j1 = 0, θ1, j2). The computation of the error bars is explained in Sect. 3.4.
plot (right), θ2
spans the range 1–8 for each value of (j1 = 0, θ1, j2). The computation of the error bars is explained in Sect. 3.4.
Current usage metrics show cumulative count of Article Views (full-text article views including HTML views, PDF and ePub downloads, according to the available data) and Abstracts Views on Vision4Press platform.
Data correspond to usage on the plateform after 2015. The current usage metrics is available 48-96 hours after online publication and is updated daily on week days.
Initial download of the metrics may take a while.