Fig. E.5
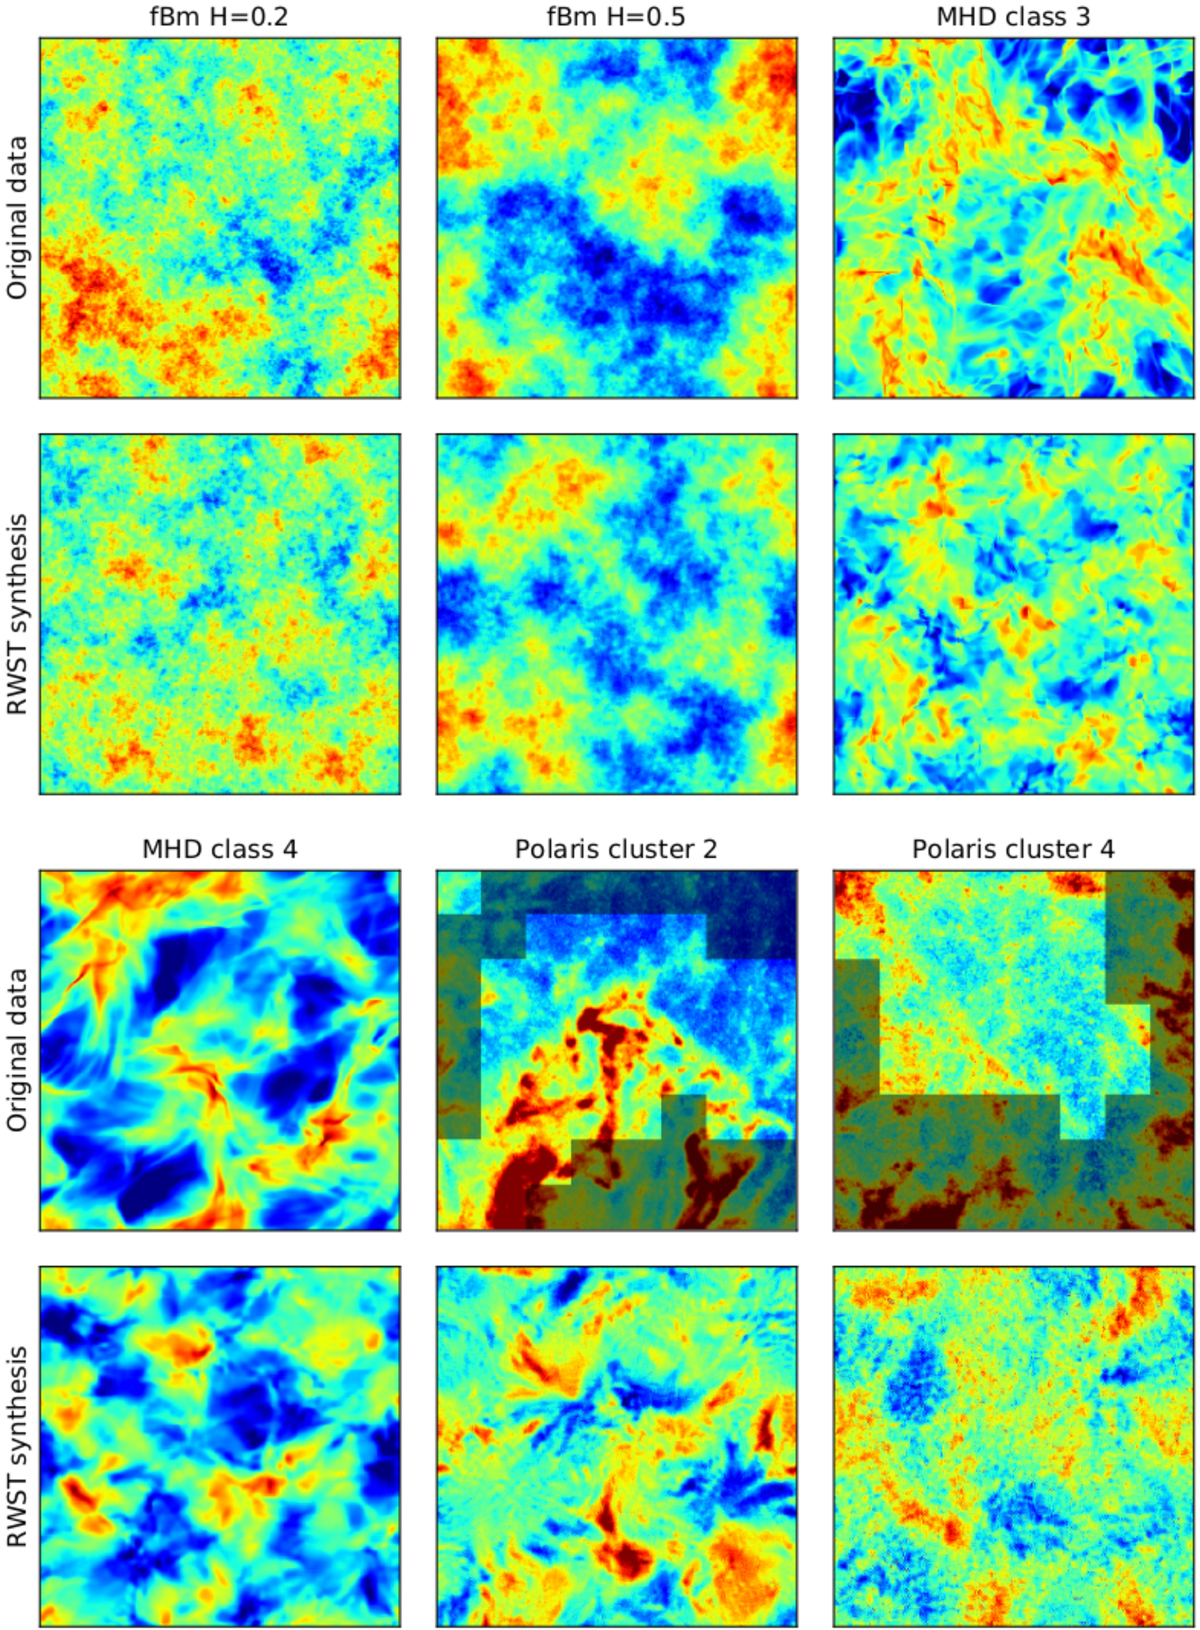
Additional examples of RWST syntheses. The RWST coefficients have been obtained from twenty 256 × 256 maps for the fBm synthetic fields and the MHD simulations, and from the different clusters of the Polaris Flare map. The original data shown here for the Polaris Flare are 256 × 256 subsets of the original map, and all regions but the cluster under study are shaded. The colourscale is the same for each pair of original and synthetic fields. For the Polaris Flare case, all maps are mean-subtracted.
Current usage metrics show cumulative count of Article Views (full-text article views including HTML views, PDF and ePub downloads, according to the available data) and Abstracts Views on Vision4Press platform.
Data correspond to usage on the plateform after 2015. The current usage metrics is available 48-96 hours after online publication and is updated daily on week days.
Initial download of the metrics may take a while.