Open Access
Fig. E.2
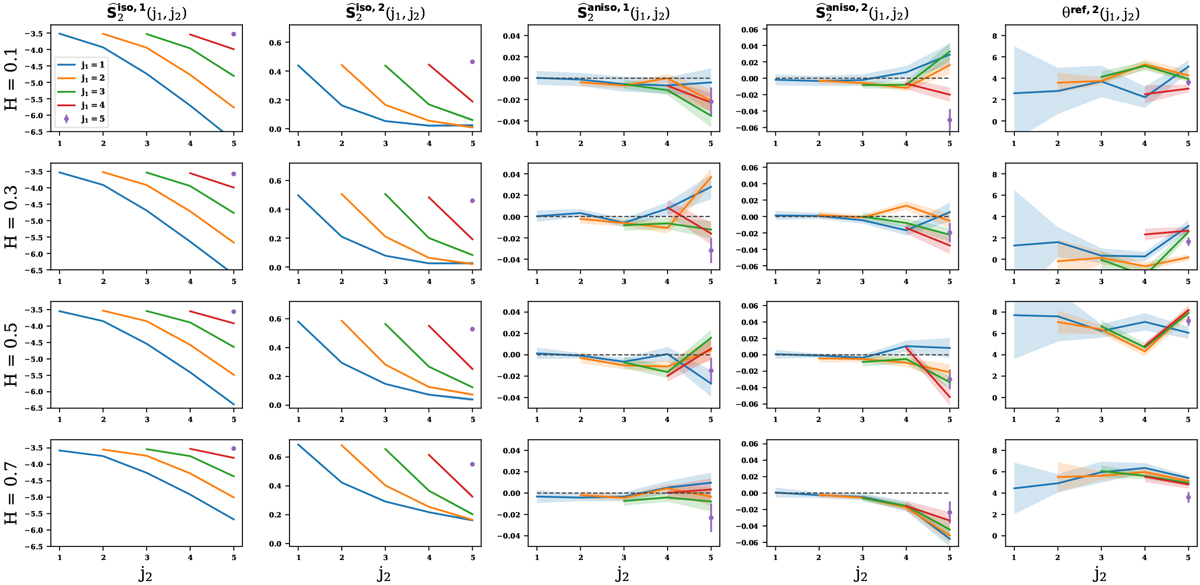
RWST coefficients for m = 2 and four classes (H = 0.1, H = 0.3, H = 0.5, H = 0.7) of fBm processes. For each class, twenty 256 × 256 maps are used. Each curve correspond to a fixed j1 value, and j2 values from j1 + 1 to 5.
Current usage metrics show cumulative count of Article Views (full-text article views including HTML views, PDF and ePub downloads, according to the available data) and Abstracts Views on Vision4Press platform.
Data correspond to usage on the plateform after 2015. The current usage metrics is available 48-96 hours after online publication and is updated daily on week days.
Initial download of the metrics may take a while.