Fig. B.2
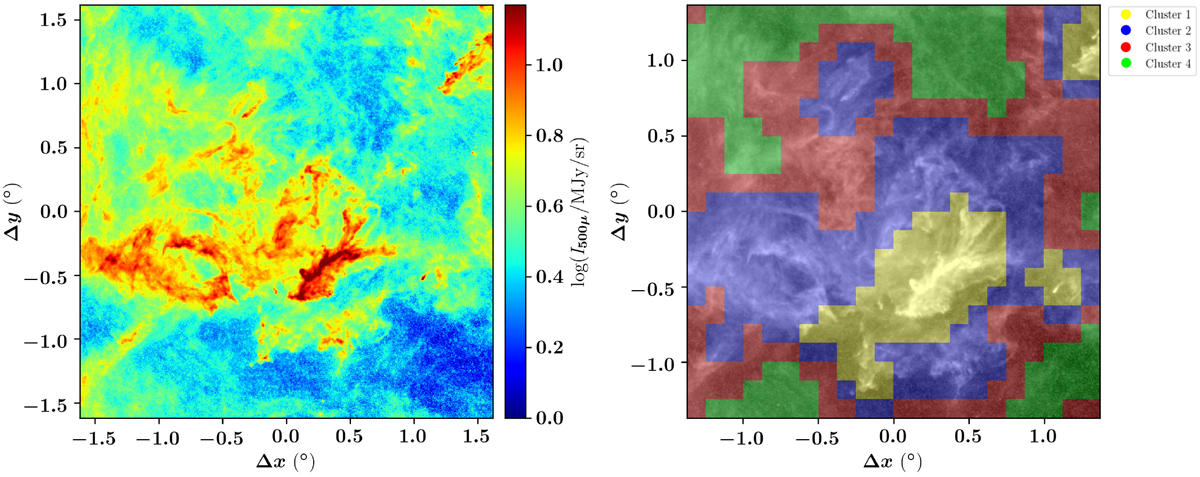
Left: dust thermal emission in the PolarisFlare observed with Herschel-SPIRE-LW at 500 μm (Miville-Deschênes et al. 2010). The initial observation has been reshaped and the orientation of the axes is arbitrary. Right: k-means clustering of the Herschel map in WST space, with k = 4. A cluster (green, red, blue, yellow colours) gathers regions of the map that have similar WST coefficients.
Current usage metrics show cumulative count of Article Views (full-text article views including HTML views, PDF and ePub downloads, according to the available data) and Abstracts Views on Vision4Press platform.
Data correspond to usage on the plateform after 2015. The current usage metrics is available 48-96 hours after online publication and is updated daily on week days.
Initial download of the metrics may take a while.