Fig. 5.
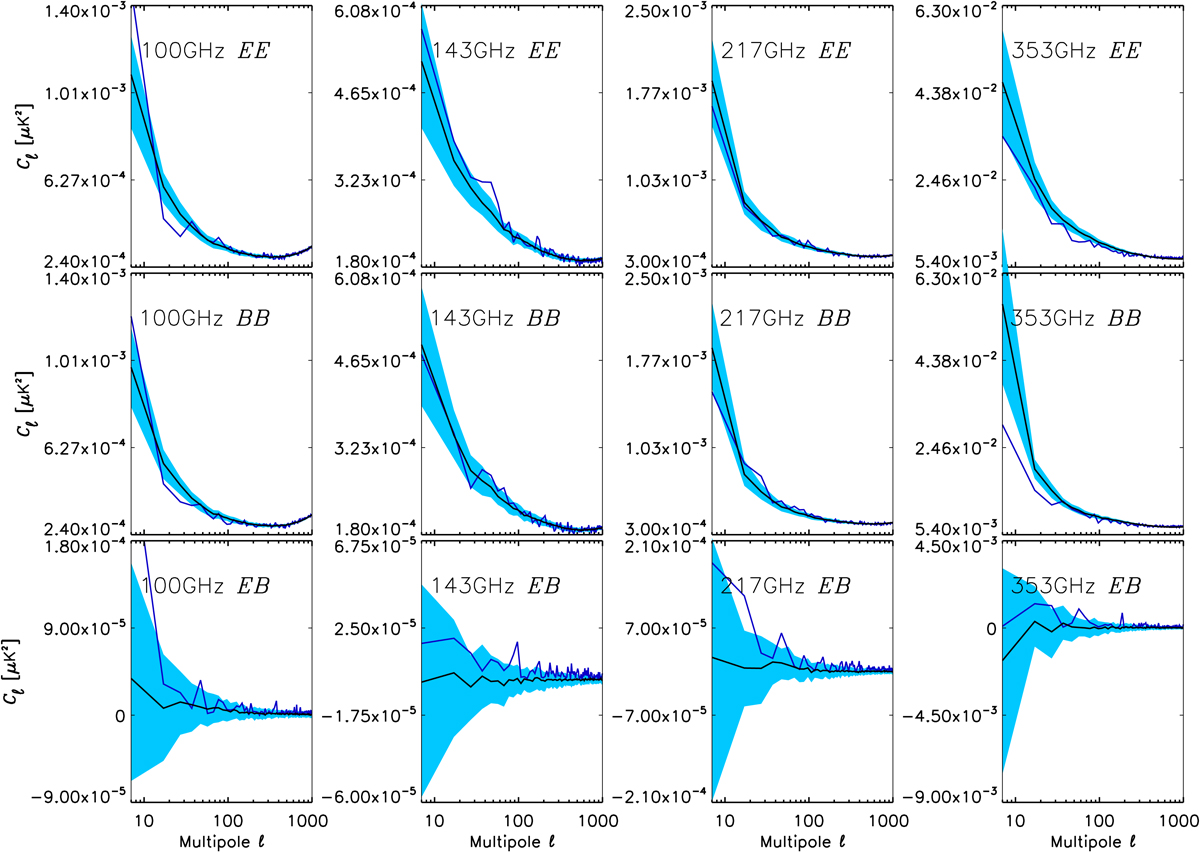
Noise and systematic residuals in EE, BB, and EB spectra, for difference maps of the half-mission null test binned by Δℓ=10. Spectra are rescaled to the full mission, and also rescaled to full sky from the unmasked sky fraction fsky = 0.43 used. Data spectra are represented by thick blue lines, and the average of simulations by thin black lines. The blue band shows one ±σ equivalent of the statistical distribution of the simulations. The linear y-axis scales are adapted to show the full data range on each panel.
Current usage metrics show cumulative count of Article Views (full-text article views including HTML views, PDF and ePub downloads, according to the available data) and Abstracts Views on Vision4Press platform.
Data correspond to usage on the plateform after 2015. The current usage metrics is available 48-96 hours after online publication and is updated daily on week days.
Initial download of the metrics may take a while.