Fig. 3.
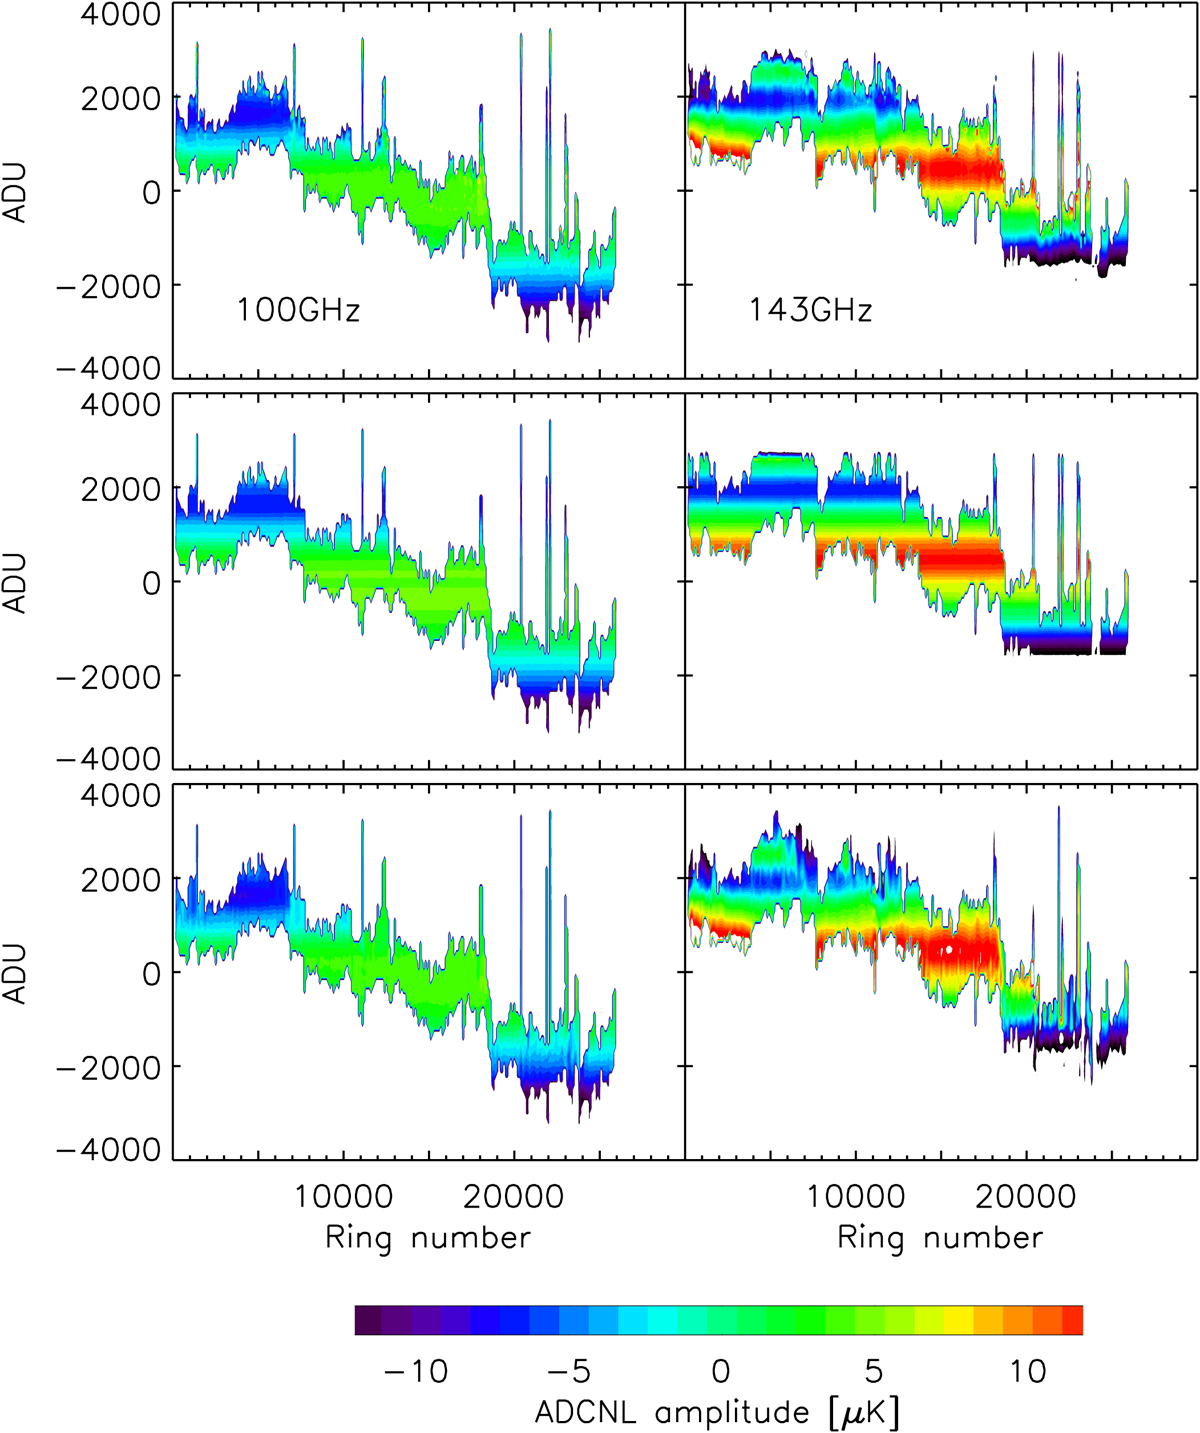
Simulated ADCNL residuals (color coded) for the ADU level on the ADC (ordinate axis) along the time, expressed as ring number. Two bolometers are shown: left column for the 100-4b and right column for the 143-1a. First row: input of the simulation, second and third rows: their fitted 1D or 2D spline corrections without noise. Typical calibration is ≃6 μK/ADU.
Current usage metrics show cumulative count of Article Views (full-text article views including HTML views, PDF and ePub downloads, according to the available data) and Abstracts Views on Vision4Press platform.
Data correspond to usage on the plateform after 2015. The current usage metrics is available 48-96 hours after online publication and is updated daily on week days.
Initial download of the metrics may take a while.