Open Access
Fig. 22.
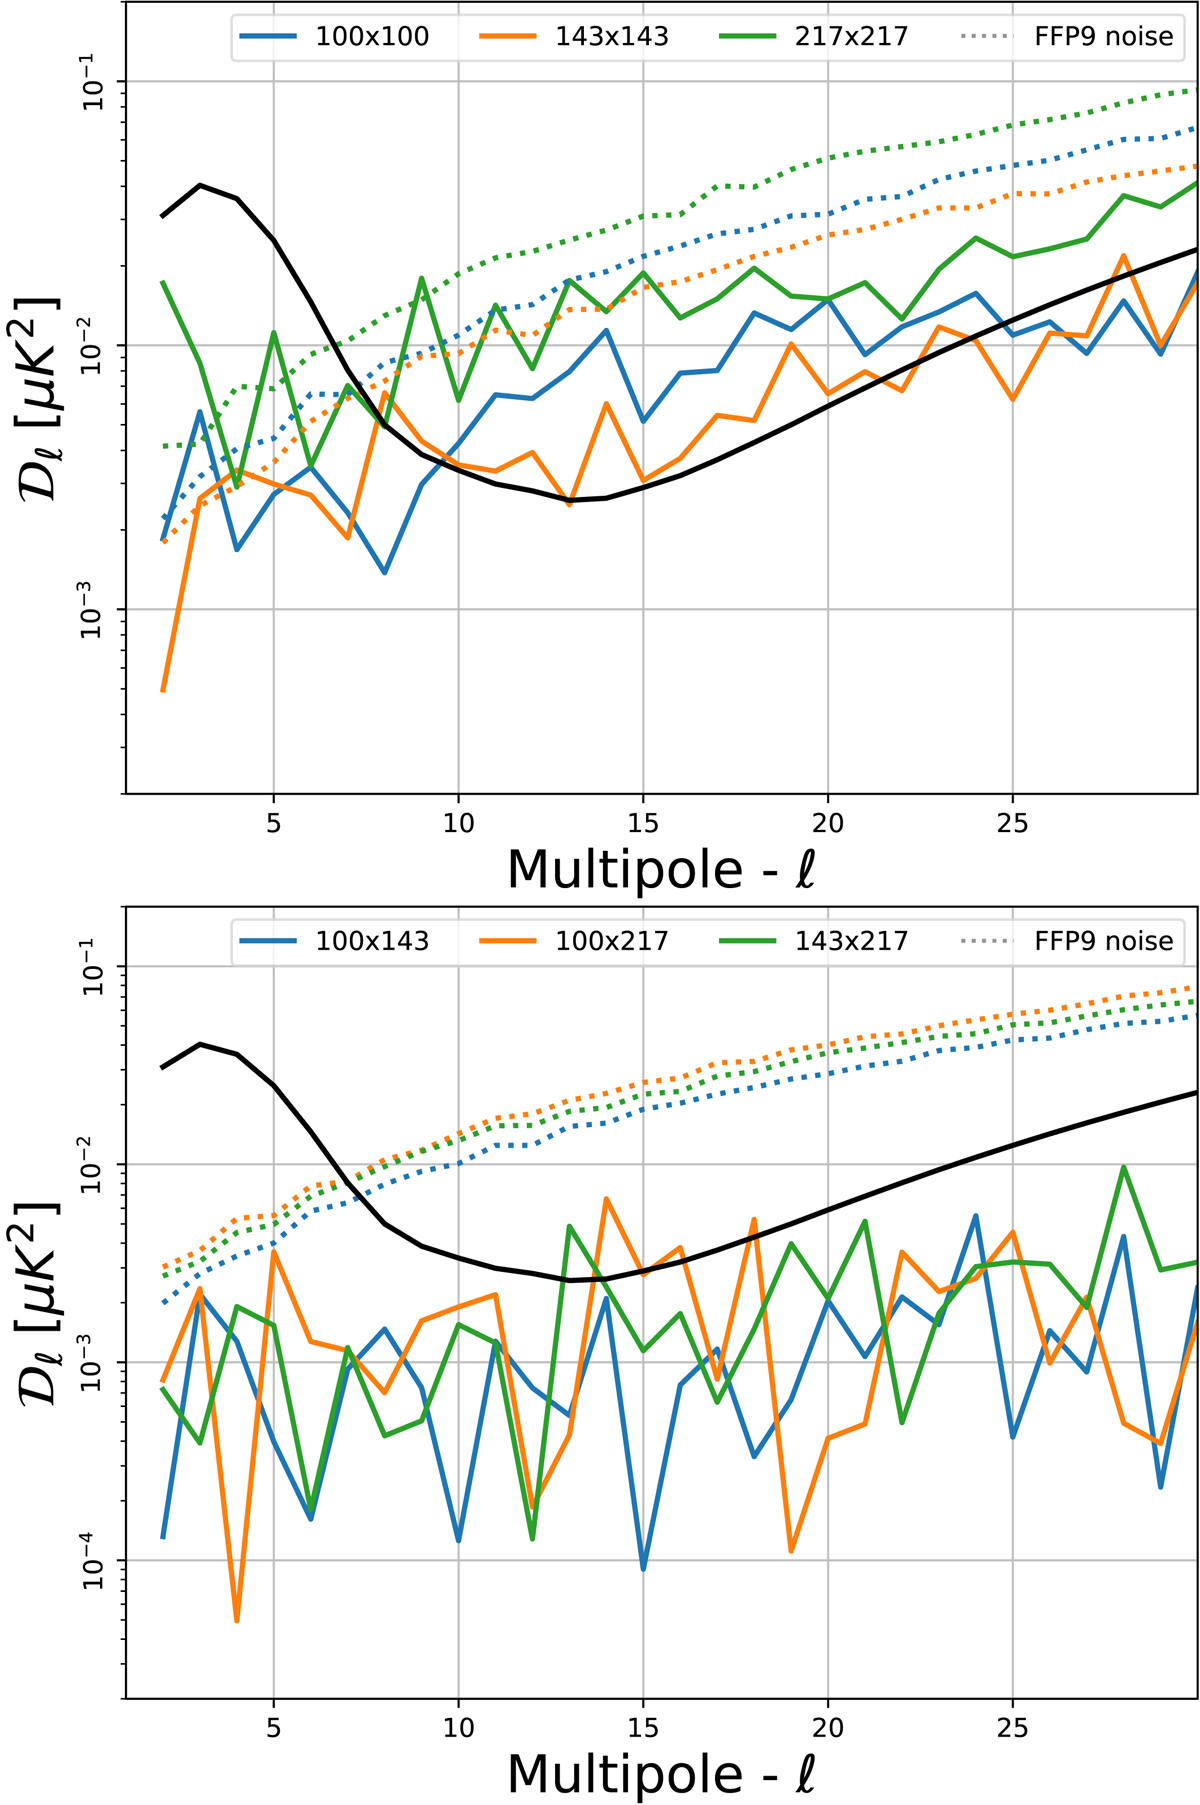
EE pseudo spectra (auto-spectra in the top panel, cross-spectra in the bottom panel) evaluated for 100 GHz, 143 GHz, and 217 GHz on the simulations shown in Fig. 21 with a symmetric Galactic cut of 20°, 66% of the sky. The black solid line corresponds to a EE power spectrum with τ = 0.055 and 1010As = 21.14.
Current usage metrics show cumulative count of Article Views (full-text article views including HTML views, PDF and ePub downloads, according to the available data) and Abstracts Views on Vision4Press platform.
Data correspond to usage on the plateform after 2015. The current usage metrics is available 48-96 hours after online publication and is updated daily on week days.
Initial download of the metrics may take a while.