Fig. 21.
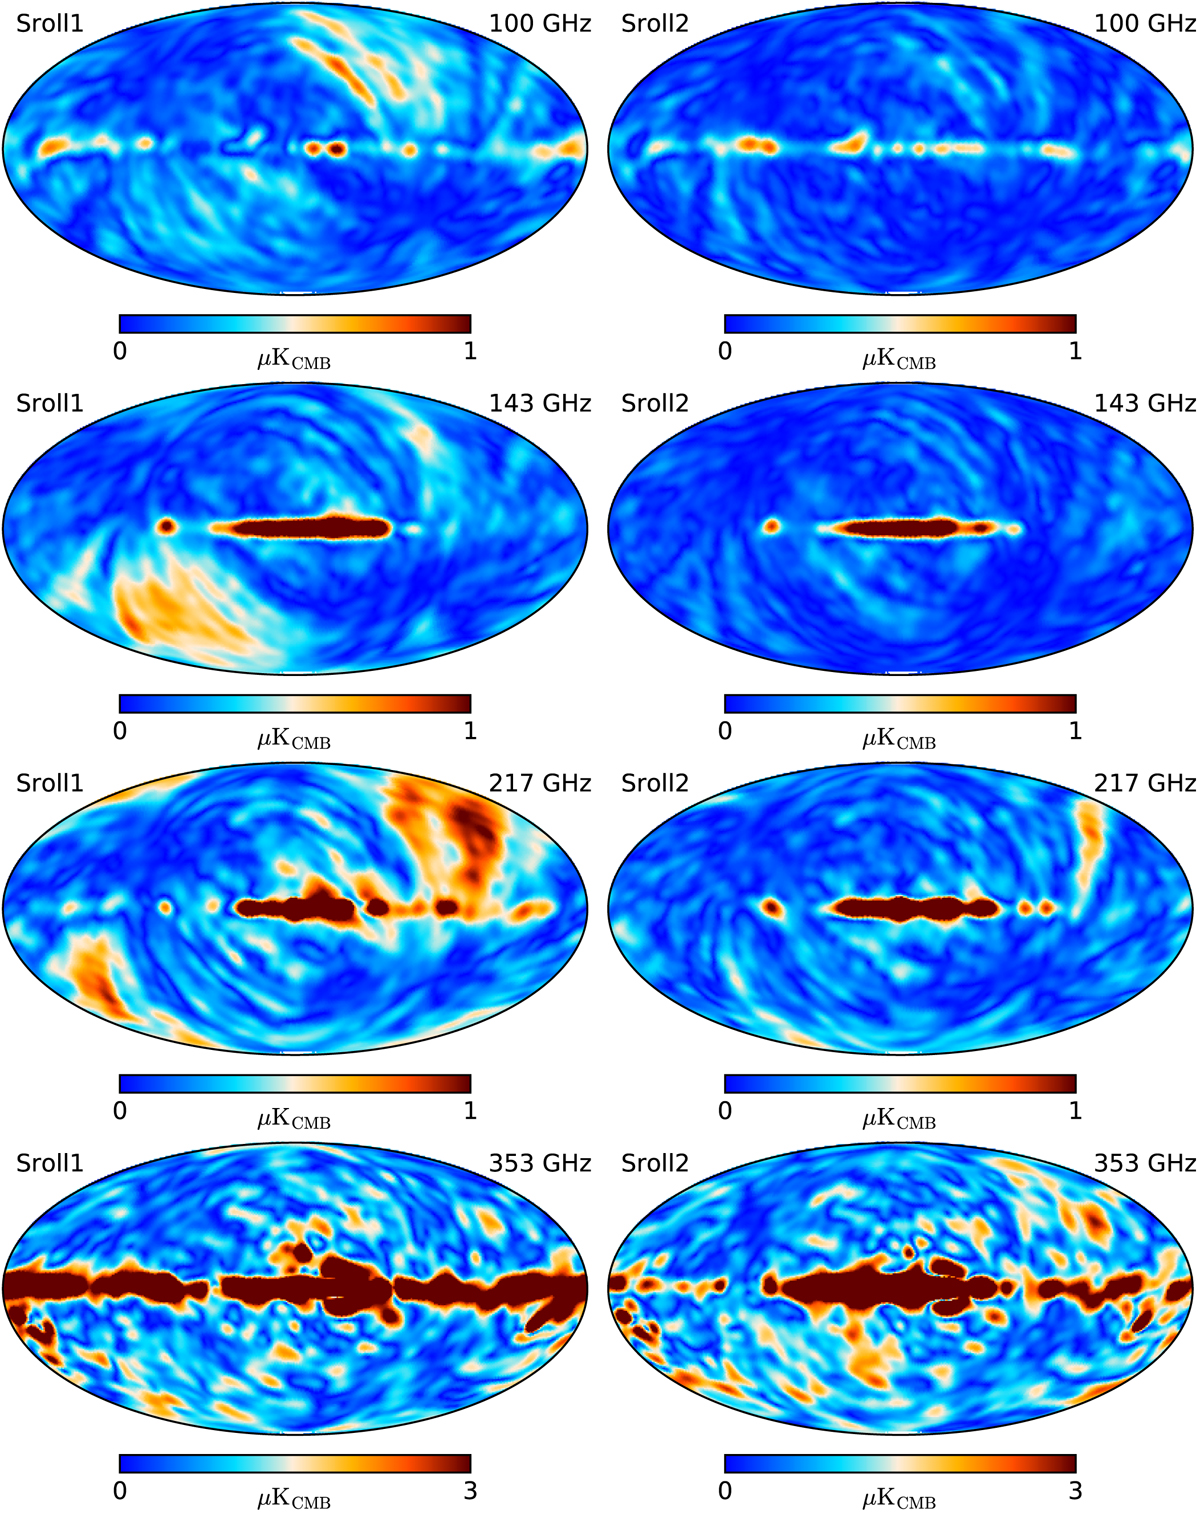
SRoll1 (left column) and SRoll2 (right column) polarization intensity maps obtained by subtracting, from the output sky map, the input sky map from a simulation including a nonlinear ADC. The simulation input map contains dipole, sky signal, and systematic effects but electronic noise only to reveal effects lower than the full noise.
Current usage metrics show cumulative count of Article Views (full-text article views including HTML views, PDF and ePub downloads, according to the available data) and Abstracts Views on Vision4Press platform.
Data correspond to usage on the plateform after 2015. The current usage metrics is available 48-96 hours after online publication and is updated daily on week days.
Initial download of the metrics may take a while.