Open Access
Fig. 2.
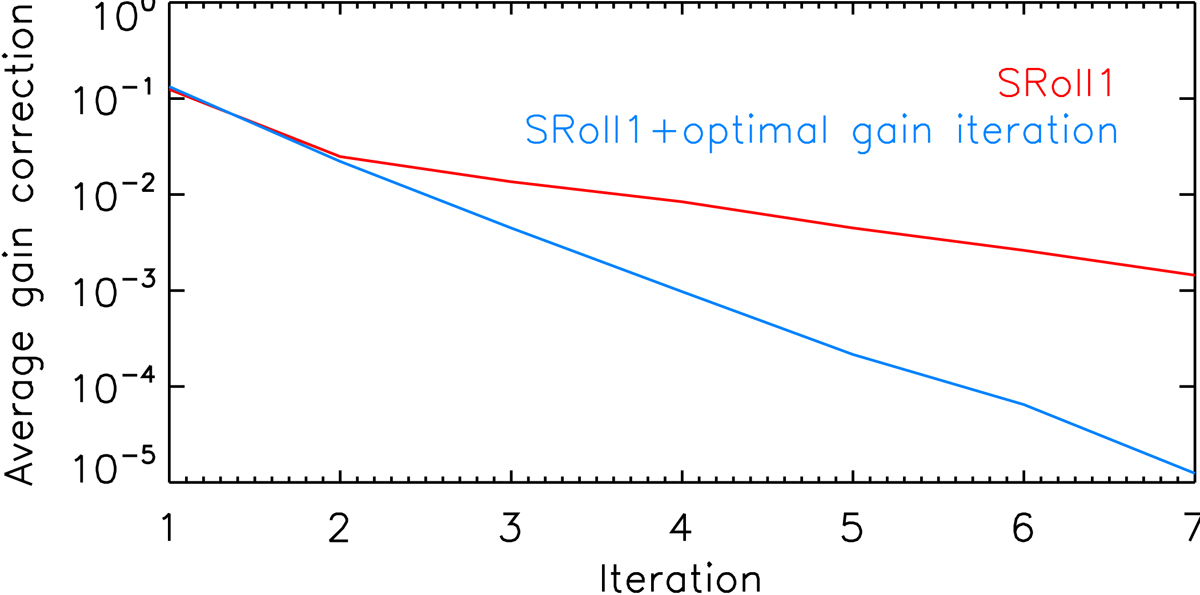
Average on all bolometers of the response correction at each iteration of the 353 GHz map when using only the total dipole (in red) and using the sky model to fit the response (in blue).
Current usage metrics show cumulative count of Article Views (full-text article views including HTML views, PDF and ePub downloads, according to the available data) and Abstracts Views on Vision4Press platform.
Data correspond to usage on the plateform after 2015. The current usage metrics is available 48-96 hours after online publication and is updated daily on week days.
Initial download of the metrics may take a while.