Fig. 14.
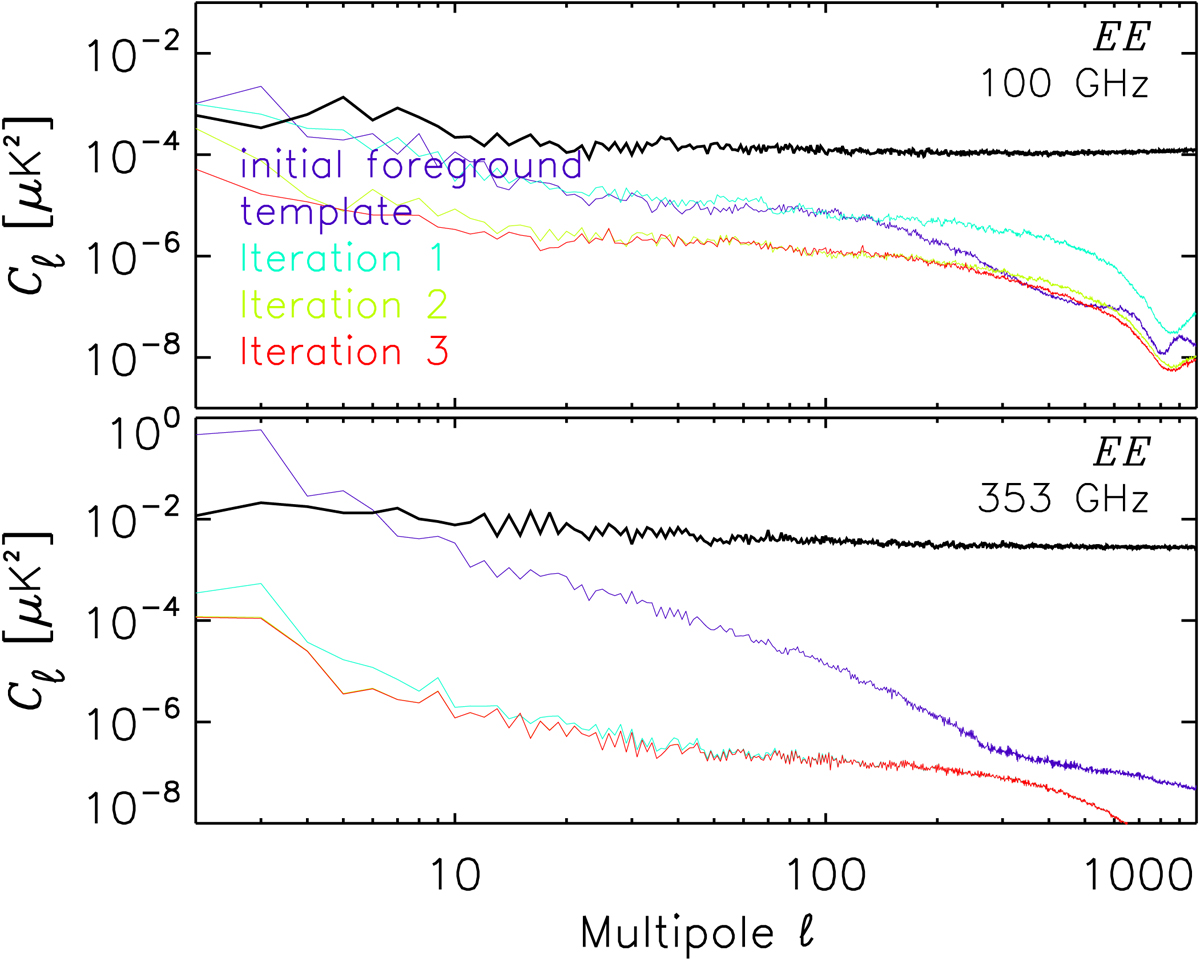
Power spectra of the initial templates and then differences between two successive iterations: first iteration in cyan, second in green, and third in red. The differences becomes quickly much smaller than the noise (black line) that is estimated from half mission difference computed with fsky = 0.43 and realigned at the full mission level.
Current usage metrics show cumulative count of Article Views (full-text article views including HTML views, PDF and ePub downloads, according to the available data) and Abstracts Views on Vision4Press platform.
Data correspond to usage on the plateform after 2015. The current usage metrics is available 48-96 hours after online publication and is updated daily on week days.
Initial download of the metrics may take a while.