Fig. 12.
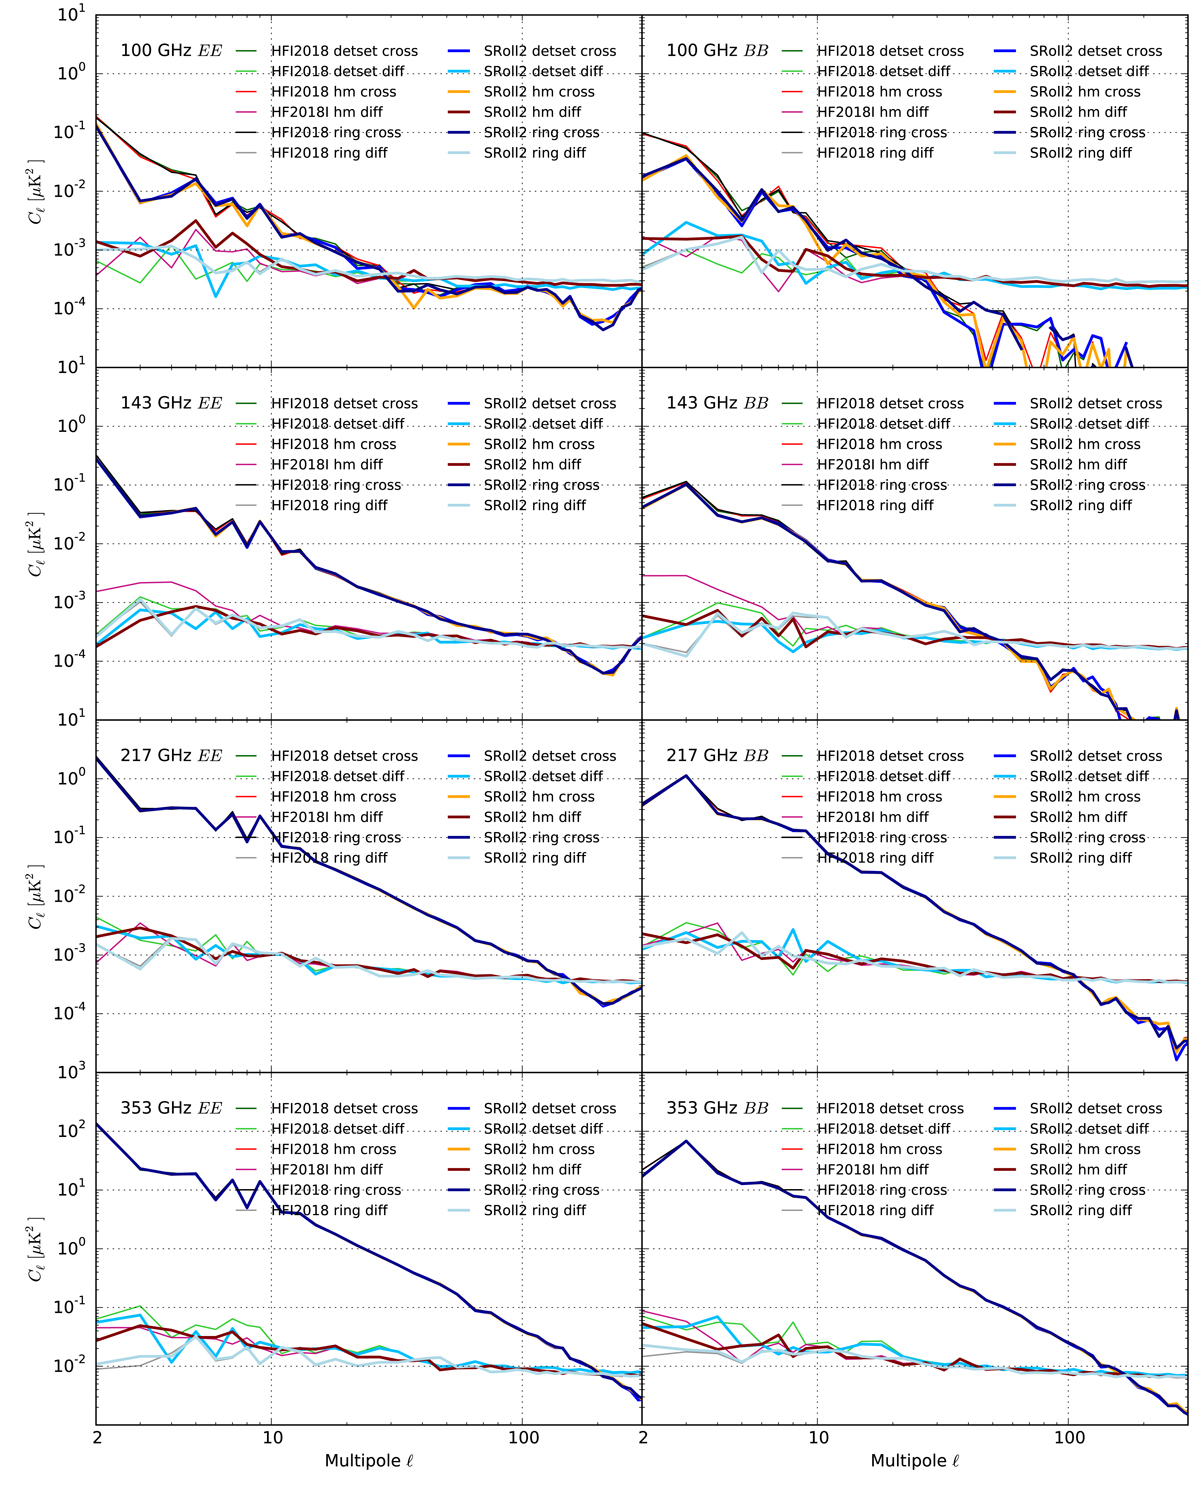
EE (left column) and BB (right column) power spectra of HFI2018 and SRoll2, based on half split data sets (detests, half-mission, and odd-even rings) maps at 100, 143, 217, and 353 GHz. Auto-spectra of the difference maps show the noise plus systematic effect residuals, rescaled to full mission equivalent and corrected for sky fraction used here (43%). The cross-spectra between the same maps are displayed and show the signal. The binning is: δℓ=1 for 2 ≤ ℓ < 30; δℓ=5 for 30 ≤ ℓ < 50; δℓ=10 for 50 ≤ ℓ < 160; δℓ=20 for 160 ≤ ℓ < 1000; and δℓ=100 for ℓ > 1000.
Current usage metrics show cumulative count of Article Views (full-text article views including HTML views, PDF and ePub downloads, according to the available data) and Abstracts Views on Vision4Press platform.
Data correspond to usage on the plateform after 2015. The current usage metrics is available 48-96 hours after online publication and is updated daily on week days.
Initial download of the metrics may take a while.