Open Access
Fig. 10.
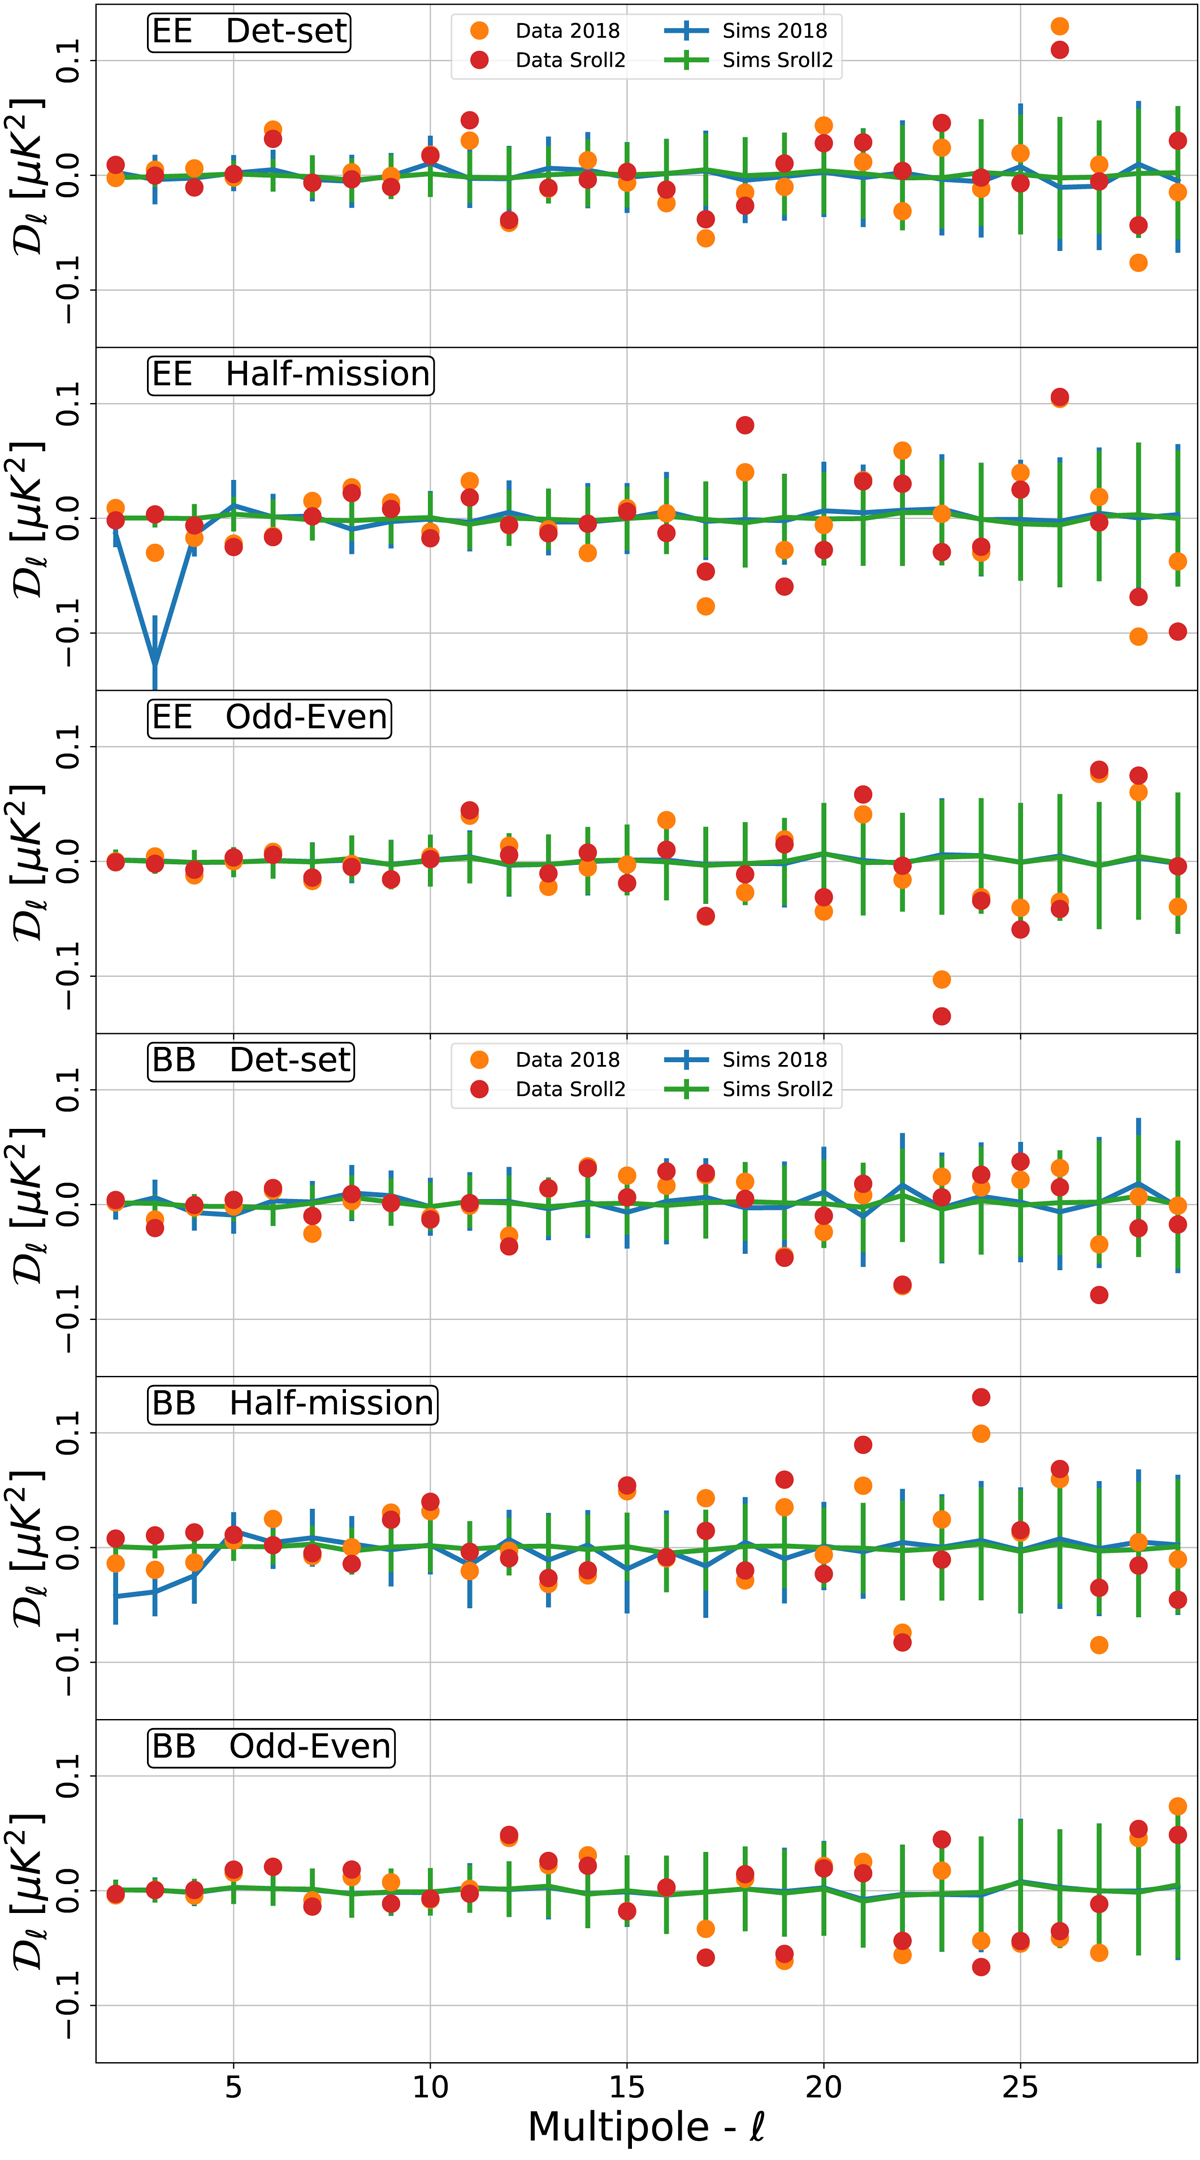
EE (upper 3 plots) and BB (lower 3 plots) power spectra of difference of null test maps for: half mission, detsets and odd-even rings, for HFI2018 (orange and blue) and SRoll2 (red and green). Data are overplotted on top of the simulations (average and dispersion).
Current usage metrics show cumulative count of Article Views (full-text article views including HTML views, PDF and ePub downloads, according to the available data) and Abstracts Views on Vision4Press platform.
Data correspond to usage on the plateform after 2015. The current usage metrics is available 48-96 hours after online publication and is updated daily on week days.
Initial download of the metrics may take a while.