Fig. 1.
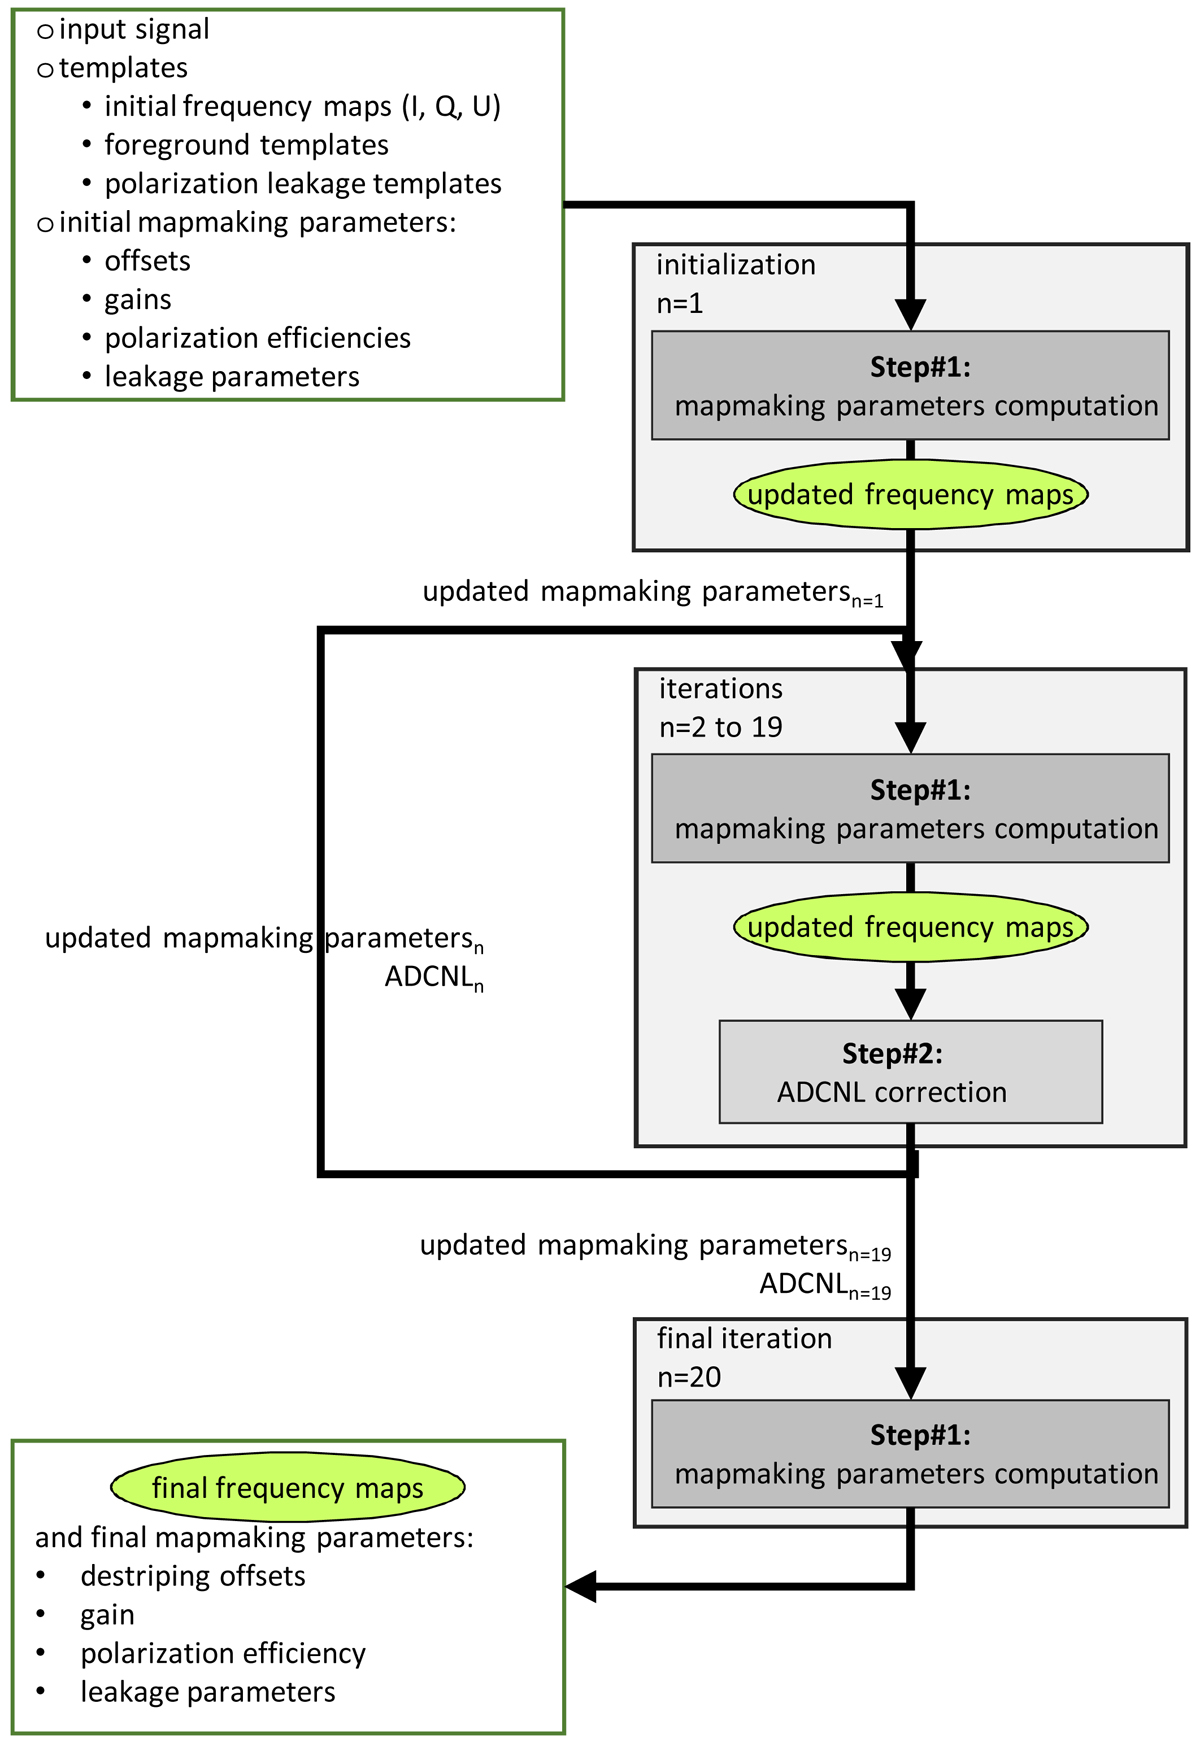
Schematic view of SRoll2 iterations for building the Stokes I, Q, and U maps for one frequency band. The top box contains the initial improvements of the maps. Step#1 algorithm uses data HPRs to consistently compute the maps, the detector response, and the systematic effects correction parameters other than ADCNL. Step#2 computes the ADCNL correction that is propagated to the subsequent iteration. In the middle box, Step#1 produces maps used as input for Step#2 that computes the ADCNL correction. This whole process is then iterated 19 times. The bottom box is again a Step#1 to build the final maps.
Current usage metrics show cumulative count of Article Views (full-text article views including HTML views, PDF and ePub downloads, according to the available data) and Abstracts Views on Vision4Press platform.
Data correspond to usage on the plateform after 2015. The current usage metrics is available 48-96 hours after online publication and is updated daily on week days.
Initial download of the metrics may take a while.