Fig. 4.
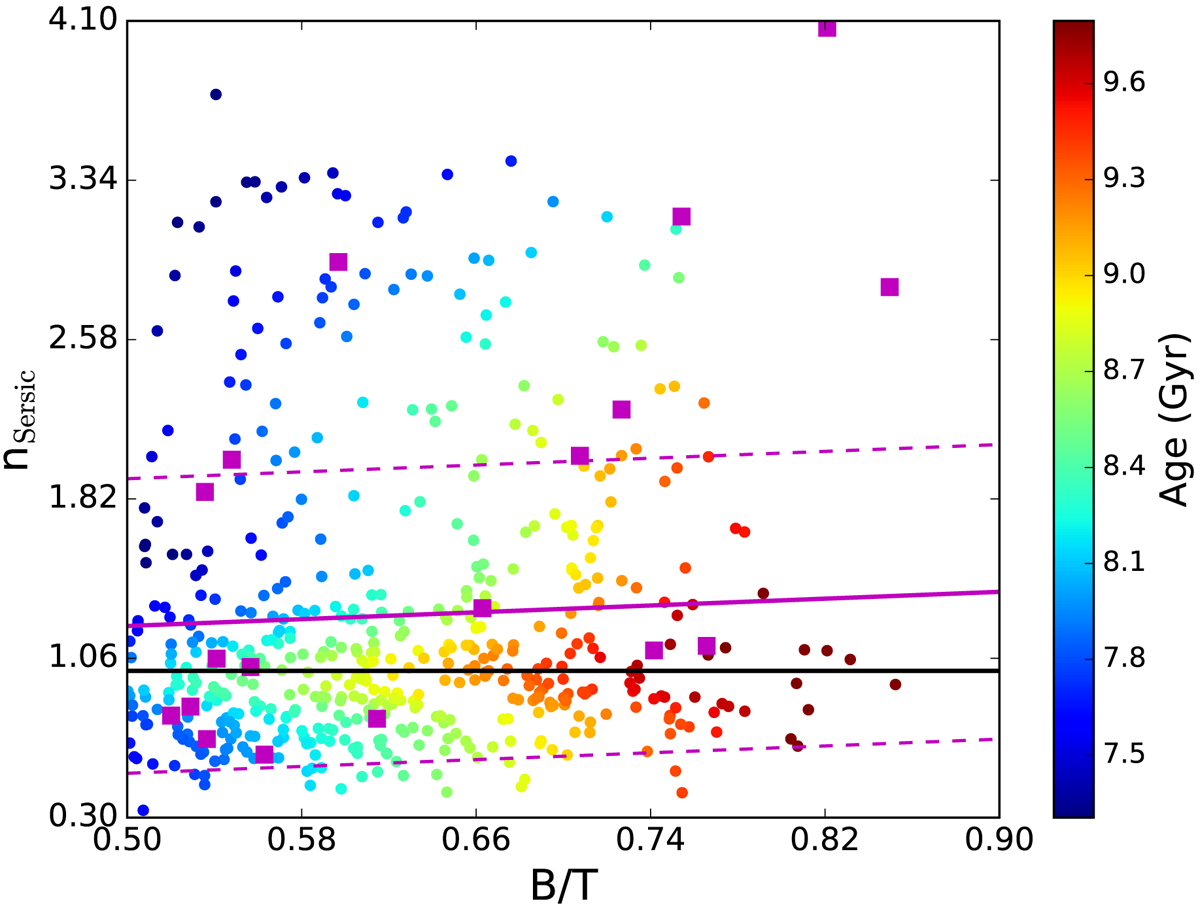
Sérsic index (nSersic) as a function of B/T ratio for the simulated E-SDGs, coloured according to the mass-weighted average age of the galaxy stellar mass. A linear regression fit is included (solid magenta line) with its 1σ dispersion (dashed magenta line). For comparison, we also include the results by Rosito et al. (2018; magenta squares). The line nSersic = 1 is depicted in a black line. See Appendix B for the non-smoothed distribution.
Current usage metrics show cumulative count of Article Views (full-text article views including HTML views, PDF and ePub downloads, according to the available data) and Abstracts Views on Vision4Press platform.
Data correspond to usage on the plateform after 2015. The current usage metrics is available 48-96 hours after online publication and is updated daily on week days.
Initial download of the metrics may take a while.