Free Access
Fig. B.7.
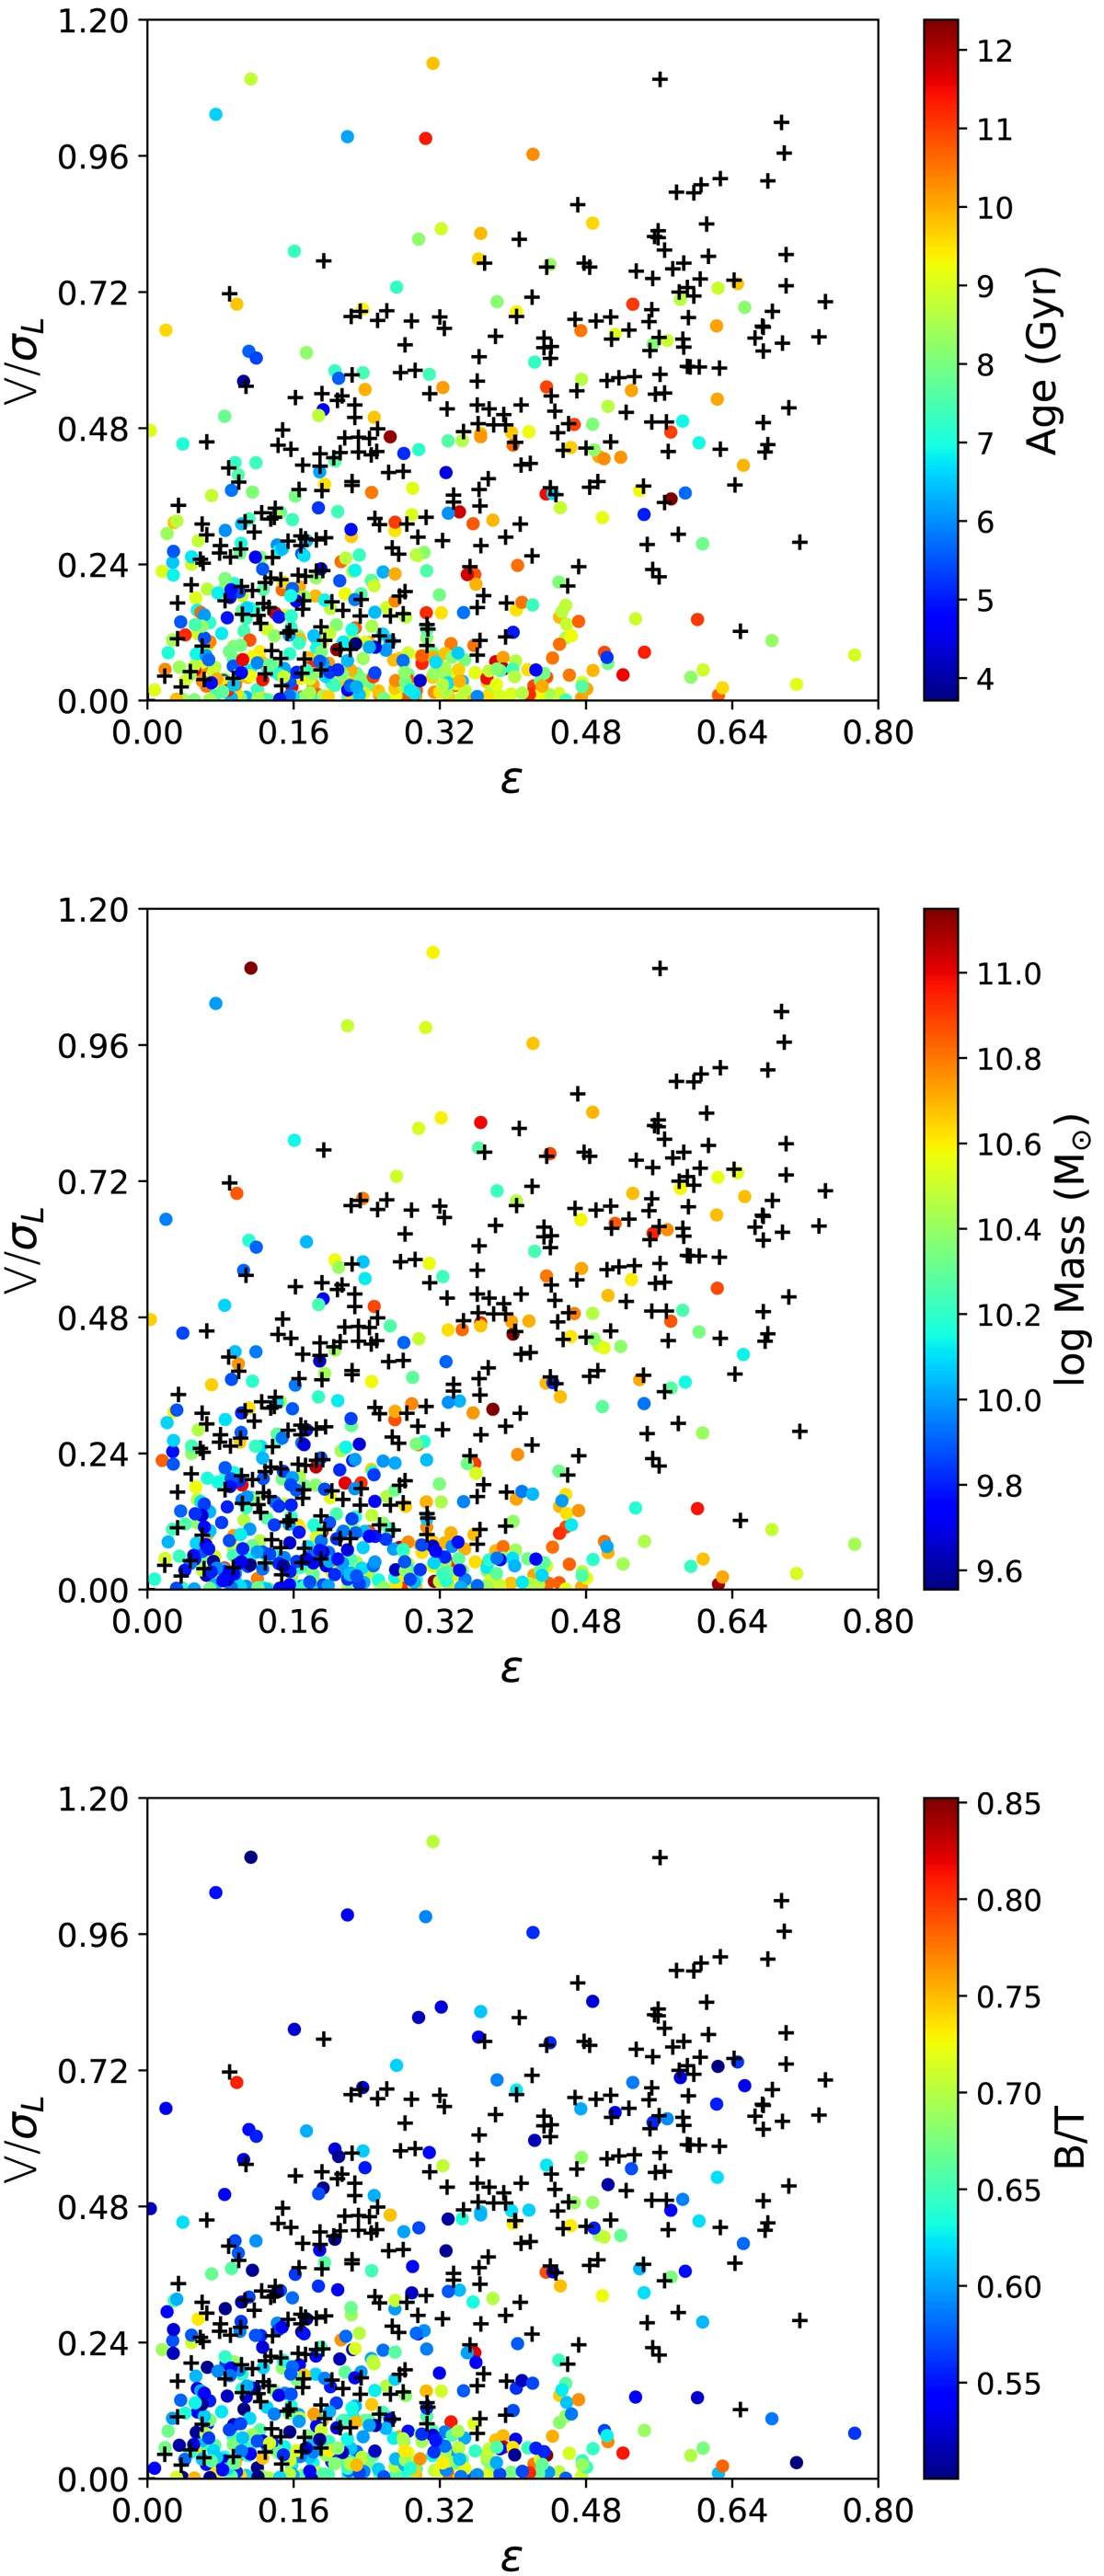
Anisotropy diagram for the E-SDGs. E-SDGs are coloured according to mass-weighted average age (top panel), stellar mass (middle panel) and B/T ratio (bottom panel). Observational data from ATLAS3D are also shown (Emsellem et al. 2011, black crosses).
Current usage metrics show cumulative count of Article Views (full-text article views including HTML views, PDF and ePub downloads, according to the available data) and Abstracts Views on Vision4Press platform.
Data correspond to usage on the plateform after 2015. The current usage metrics is available 48-96 hours after online publication and is updated daily on week days.
Initial download of the metrics may take a while.