Fig. B.4.
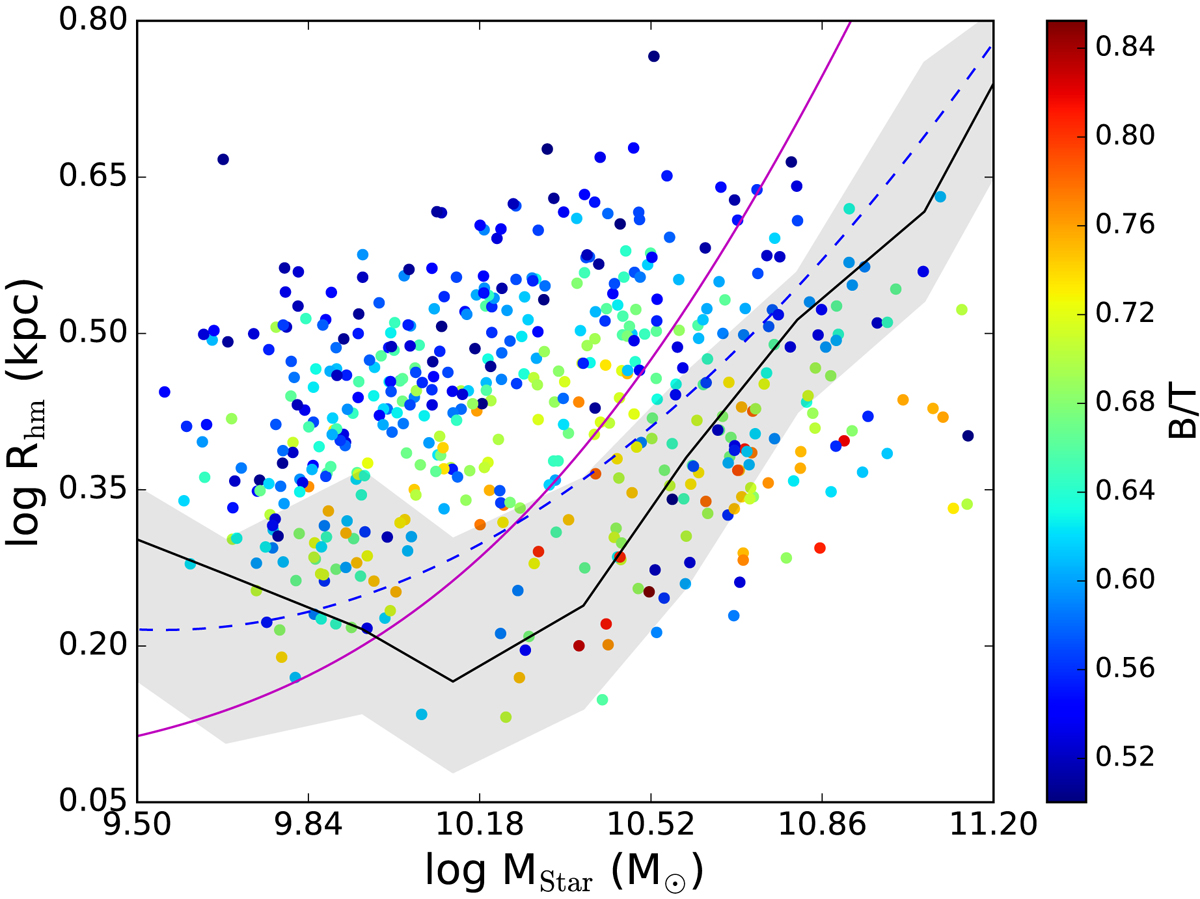
Mass-size relation estimated for the E-SDGs. Symbols are coloured according to their B/T ratio. The median of the observations from ATLAS3D (black line; the first and third quartiles are shown as shadowed region) and the observed relations for ETGs reported by Mosleh et al. (2013, solid magenta line) and Bernardi et al. (2014, dashed blue line) are included for comparison.
Current usage metrics show cumulative count of Article Views (full-text article views including HTML views, PDF and ePub downloads, according to the available data) and Abstracts Views on Vision4Press platform.
Data correspond to usage on the plateform after 2015. The current usage metrics is available 48-96 hours after online publication and is updated daily on week days.
Initial download of the metrics may take a while.